


Gli avvisi personalizzati e la visualizzazione dei dati consentono di identificare e prevenire rapidamente ogni tipo di problema nell'intera rete.
Gli strumenti per i diagrammi di rete svolgono un ruolo cruciale in tutti gli ambienti di rete professionali, aiutando gli ingegneri di rete a tenere traccia di tutto ciò che è importante. Ecco come PRTG può aiutarvi a creare diagrammi di rete personalizzati.
Con PRTG è facile costruire mappe e diagrammi di rete personalizzati. Con il nostro Editor mappe drag-and-drop, è possibile visualizzare le dipendenze, aggiungere immagini di sfondo come le planimetrie dei data center e scegliere tra molti altri widget precostituiti per la visualizzazione individuale.
Includete nei vostri diagrammi di rete tutti i componenti di rete che desiderate tenere sotto controllo, dai router agli switch, dai server ai firewall. Grazie alla rappresentazione visiva con codici colore, è possibile vedere a colpo d'occhio se c'è un problema nella vostra infrastruttura e intervenire prima che il problema diventi critico per l'azienda.
Avete bisogno di visualizzare più di un diagramma topologico di rete? Nessun problema. PRTG consente di impostare le mappe basate su HTML in modo che ruotino sullo schermo, così da non dover scegliere tra le singole visualizzazioni dell'infrastruttura di rete e sapere sempre cosa sta succedendo nell'intera rete.
Diagnosticare i problemi di rete monitorando continuamente la disponibilità, la salute e le prestazioni dell'intera rete tramite disegni logici di rete personalizzati. Mostra i parametri hardware, il traffico di rete, l'utilizzo della larghezza di banda e altre metriche chiave in tempo reale. Visualizzate i dati di monitoraggio in grafici e dashboard chiari per identificare più facilmente i problemi. Ottenete la Panoramica necessaria per risolvere ogni tipo di problema nella vostra infrastruttura LAN, WAN, virtuale o cloud.

Grafico dei dati di traffico in tempo reale in PRTG
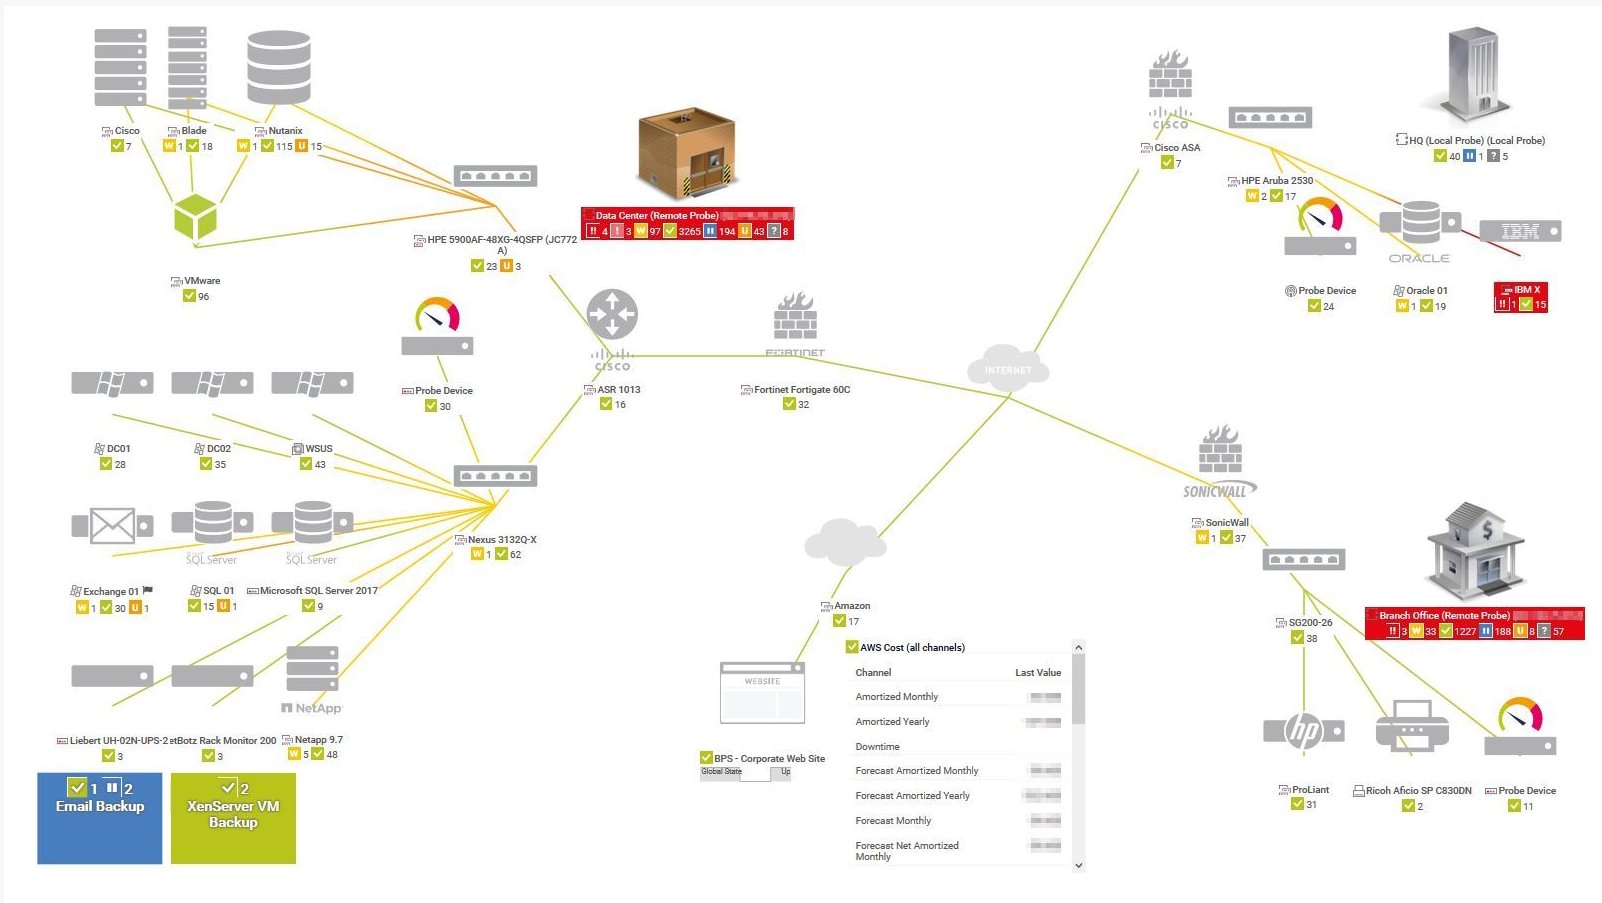
Mappa della topologia di rete in PRTG
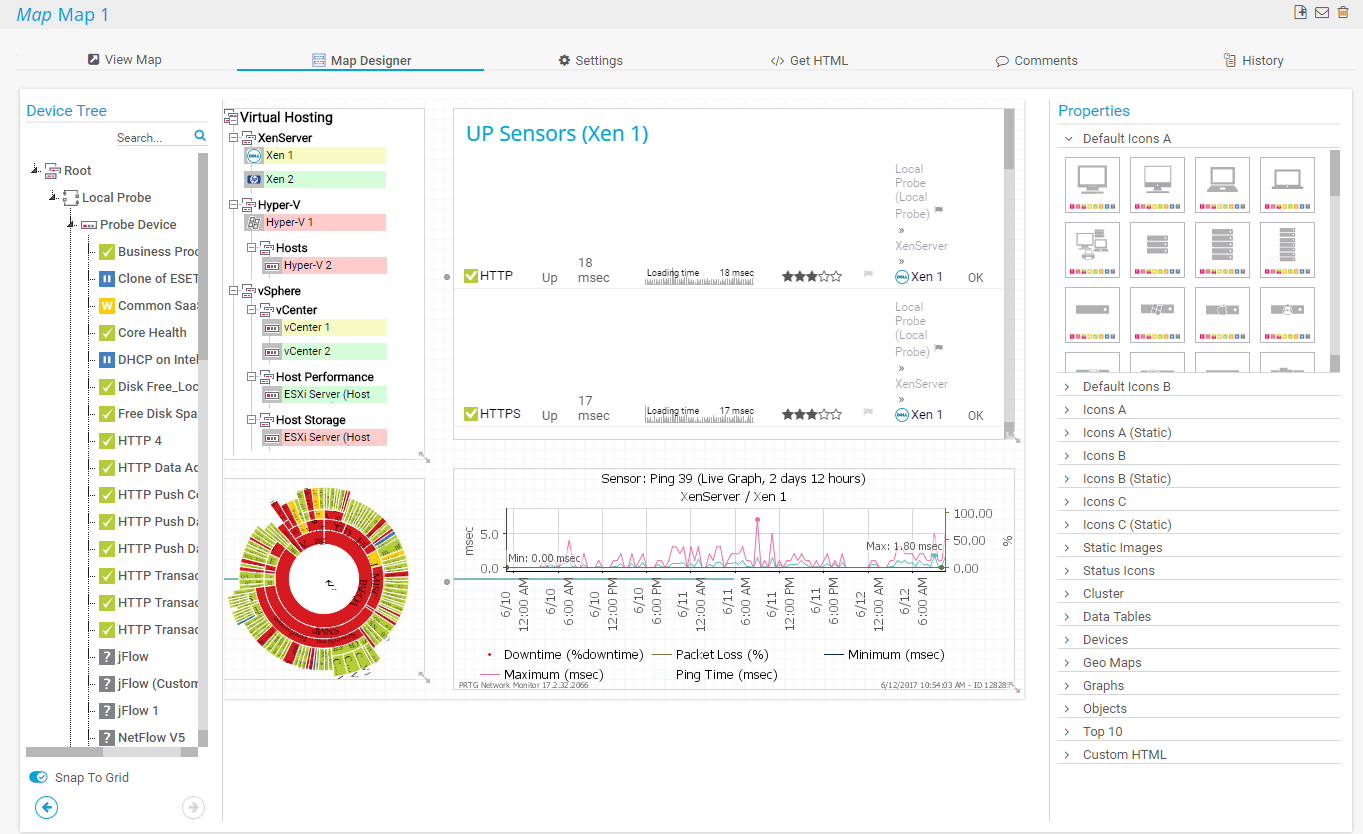
Map Designer in PRTG

Albero dei dispositivi dell'intera configurazione di monitoraggio

Dashboard PRTG personalizzato per tenere sotto controllo l'intera infrastruttura IT
Grafico dei dati di traffico in tempo reale in PRTG
Mappa della topologia di rete in PRTG
“Monitor di rete vincente sotto tutti i punti di vista”
“La vera bellezza di PRTG sta nelle infinite possibilità che offre”
“PRTG Network Monitor
è molto difficile da superare”
Con PRTG è possibile costruire diagrammi di rete personalizzati con un focus individuale sulla propria azienda o infrastruttura.
Il PRTG esegue regolarmente la scansione delle sottoreti e visualizza i dispositivi di rete scoperti in una chiara visualizzazione ad albero dei dispositivi. È inoltre possibile scegliere tra due ulteriori visualizzazioni: la vista Sunburst o la vista heatmap. Tutti i componenti sono cliccabili, in modo da poter approfondire l'infrastruttura secondo le necessità.
Utilizzando l'editor drag-and-drop del PRTG, è possibile creare facilmente diagrammi di rete, mappe e dashboard personalizzati e concisi. In questo modo si ottengono rappresentazioni visive utili e chiare, basate sui requisiti individuali e che riducono al minimo il sovraccarico di informazioni sugli avvisi.
Utilizzate l'HTML per arricchire i diagrammi personalizzati con informazioni aggiuntive, come servizi meteo e traffico, o per creare manualmente dei livelli sulle mappe. Per una funzionalità automatizzata "layer-to-map", provate l'integrazione di UVexplorer tramite PRTG API.
La capacità di personalizzazione è il punto di forza dei diagrammi di PRTG. Mentre altri diagrammi di reti complesse possono diventare rapidamente opprimenti, le mappe personalizzate di PRTG possono essere ridotte all'essenziale. Selezionate la topologia e gli elementi che dovete realmente vedere e tralasciate tutto il resto.
Gli avvisi personalizzati e la visualizzazione dei dati consentono di identificare e prevenire rapidamente ogni tipo di problema nell'intera rete.

In generale, esistono due tipi diversi di strumenti per la creazione di diagrammi di rete: gli scanner di rete automatici o gli strumenti manuali per i diagrammi di rete.
Le applicazioni manuali di solito forniscono simboli per switch, server, stampanti e simili, consentendo di disegnare un diagramma personalizzato della rete.
Gli scanner di rete automatizzati eseguono autonomamente la scansione della rete tramite ping, SNMP, WMI e altri protocolli per trovare i componenti esistenti e aggiungerli a una vista di rete automatizzata.
Entrambi i tipi di programmi per diagrammi di rete presentano vantaggi e svantaggi. Gli strumenti di diagramma manuale, che si concentrano sulla personalizzazione, hanno un ampio set di funzionalità e si adattano esattamente alle esigenze di un'organizzazione. Tuttavia, richiedono che il personale IT conosca a fondo l'intera struttura della rete o abbia accesso a tutte le informazioni necessarie per creare il diagramma.
Il vantaggio di uno scanner di rete, che funziona in modo più indipendente, è che il diagramma può essere creato senza alcuna interazione umana. Se si configura il lavoro di scansione come attività ricorrente, le mappe di rete vengono anche aggiornate automaticamente. Tuttavia, potrebbero non includere le informazioni di cui gli amministratori hanno realmente bisogno e potrebbero richiedere una modifica manuale in seguito.
Gli strumenti avanzati per i diagrammi di rete del PRTG offrono il rilevamento automatico della rete e la creazione di diagrammi, oltre a un editor di mappe drag-and-drop per la mappatura personalizzata della rete, combinando così i vantaggi di entrambi gli scanner di rete automatizzati e degli strumenti manuali per i diagrammi.
IT esegue la scansione della rete per identificare automaticamente i dispositivi e le loro connessioni, riducendo il lavoro manuale di creazione di una mappa di rete. Quando le condizioni della rete cambiano, IT è in grado di aggiornare la visualizzazione della rete in tempo reale, garantendo che sia sempre attuale.
D'altra parte, PRTG consente di creare facilmente dashboard, mappe e diagrammi personalizzati, proprio come piace a voi, utilizzando l'editor di mappe PRTG drag-and-drop.
Le notifiche in tempo reale consentono una risoluzione più rapida dei problemi, in modo da poter intervenire prima che si verifichino problemi più gravi.
Configurate PRTG in pochi minuti e utilizzatelo su quasi tutti i dispositivi mobili.

Grazie alla collaborazione con fornitori IT innovativi, Paessler libera sinergie per creare nuovi e ulteriori vantaggi per i suoi clienti.
L'integrazione dei risultati del monitoraggio di PRTG nelle mappe di NetBrain costituisce la base per l'automazione della rete.

La combinazione dell'ampio set di funzioni di monitoraggio di PRTG con la garanzia di rete automatizzata di IP Fabric crea un nuovo livello di visibilità e affidabilità della rete.

Combinando i loro strumenti in una potente soluzione per l'analisi avanzata e l'automazione, KnowledgeRiver e Paessler consentono ai team IT di garantire le migliori prestazioni per le loro infrastrutture e reti.
Gli avvisi personalizzati e la visualizzazione dei dati consentono di identificare e prevenire rapidamente ogni tipo di problema nell'intera rete.
Software di monitoraggio della rete – Versione 24.4.102.1351 (November 12th, 2024)
Disponibile il download della versione per Windows e della versione cloud-based PRTG Hosted Monitor
Inglese, tedesco, spagnolo, francese, portoghese, olandese, russo, giapponese e cinese semplificato
Dispositivi di rete, larghezza di banda, server, applicazioni, ambienti virtuali, sistemi remoti, IoT e molto altro
Scegli l'abbonamento a PRTG Network Monitor più adatto a te


Un creatore di diagrammi di rete è uno strumento o un'applicazione software utilizzata per creare rappresentazioni visive della struttura, delle connessioni e dei componenti di una rete di computer. Questi diagrammi aiutano a comprendere, pianificare, progettare e risolvere i problemi delle reti, illustrando come sono interconnessi dispositivi quali router, switch, server e computer.
Le caratteristiche principali di un creatore di diagrammi di rete includono:
Gli strumenti di diagramma di rete offrono una serie di vantaggi che aiutano le organizzazioni e i professionisti IT a gestire, pianificare e risolvere in modo efficiente le loro reti. Ecco i vantaggi principali:
I diagrammi di rete sono di vari tipi, a seconda dell'aspetto della rete su cui si concentrano e del livello di dettaglio richiesto. Ecco alcuni esempi di diagrammi di rete:
Sì! PRTG offre un monitoraggio completo per un'ampia gamma di server applicativi PRTG, tra cui Apache, Nginx, IIS e altri. Che si tratti di Windows, Linux o di un ambiente misto, PRTG offre la flessibilità necessaria per monitorare tutte le metriche chiave relative alle prestazioni del server web.
In PRTG, i “sensori” sono gli elementi base del monitoraggio. Un sensore monitora solitamente un valore misurato nella tua rete (ad esempio, il traffico di una porta switch, il carico della CPU di un server o lo spazio libero di un’unità disco). In media, occorrono circa 5-10 sensori per ogni dispositivo o un sensore per ogni porta switch.
Paessler ha condotto prove in oltre 600 dipartimenti IT in tutto il mondo per mettere a punto il suo software di monitoraggio di rete più vicino alle esigenze dei sysadmin. Il risultato è che più del 95% degli intervistati consiglierebbe PRTG – o lo ha già fatto.

Paessler PRTG è utilizzato da aziende di tutte le dimensioni. Gli amministratori di sistema adorano PRTG perché rende il loro lavoro molto più semplice.
Ampiezza di banda, server, ambienti virtuali, siti Web, servizi VoIP - PRTG tiene d'occhio la tua intera rete.
Tutti hanno esigenze di monitoraggio diverse. Ecco perché ti lasciamo provare PRTG gratuitamente. Inizia oggi stesso la tua prova.

