Custom alerts and data visualization let you quickly identify and prevent downtime, potential security threats, and network performance issues.
Nobody enjoys working out what's causing network issues.
It can take hours. If you're lucky.
More likely, you might be looking at several days' worth of combing through logs to pinpoint what's wrong…
Powerful, accurate, and easy to implement, Paessler PRTG network troubleshooting tools take the pain out of identifying and fixing network problems, making it a simple and straightforward process.
Our network diagnostics software continuously monitors your network and homes in on any issues, so you can troubleshoot them quickly and bring your network back to 100% efficiency in no time.

No network is too large or complex for PRTG. With 250+ preconfigured sensors and an intuitive, highly customizable dashboard, you can spot trouble and work out whether it's a hardware, software, or system issue with a few clicks.
Go back as far as you need to, and home in on when the problem started. You can also generate custom reports which you can use to get your higher-ups up to speed with the current state of your infrastructure… and let them know it's time to upgrade.
Prevention is better than the cure. PRTG's configurable alerts notify you at the first sign of a possible problem, so you can take prompt action (and look good with your colleagues and your boss). Choose from various notification methods like email, SMS, or push notification.
Paessler's friendly support team is always on hand to help. We answer most queries within 24 hours. And our products come with extensive, easy-to-understand documentation, including the Paessler Knowledge Base, detailed how-tos, and video tutorials.
Diagnose network issues by continuously tracking hardware, applications, network configurations, Ethernet and Wi-Fi internet connections, as well as LAN and virtual network parameters. Show latency, packet loss, data traffic, bandwidth bottlenecks, and other key metrics in real time. Visualize monitoring data in clear graphs and dashboards to identify problems more easily. Gain the overview you need to troubleshoot all kinds of network security, availability, performance, and connectivity issues.

Device tree view of the complete monitoring setup

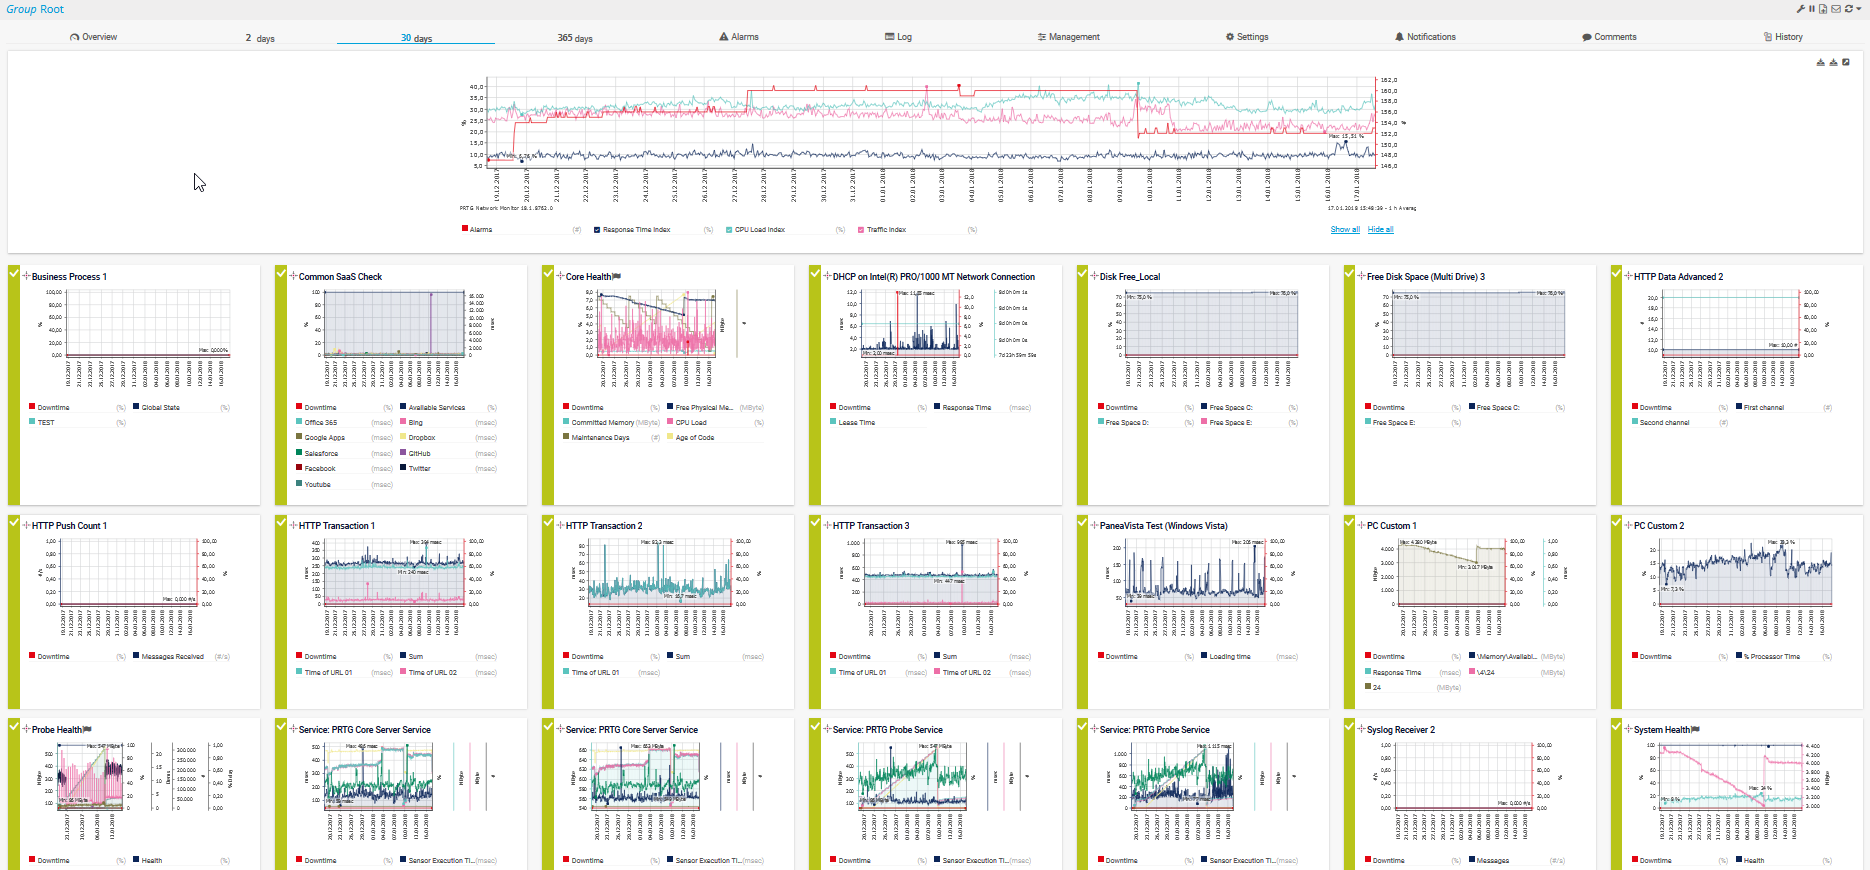
Custom PRTG dashboard for keeping an eye on the entire IT infrastructure

Live traffic data graph in PRTG
Device tree view of the complete monitoring setup
“All-around winning
network monitor”
“The real beauty of PRTG is the endless possibilities it offers”
“PRTG Network Monitor
is very hard to beat”
PRTG comes with many native sensors that keep a constant eye on specific parameters. For each parameter, you can set your preferred threshold. PRTG alerts you if performance falls under the threshold, so you can immediately check what's going on and sort it. PRTG analysis and diagnostics includes:
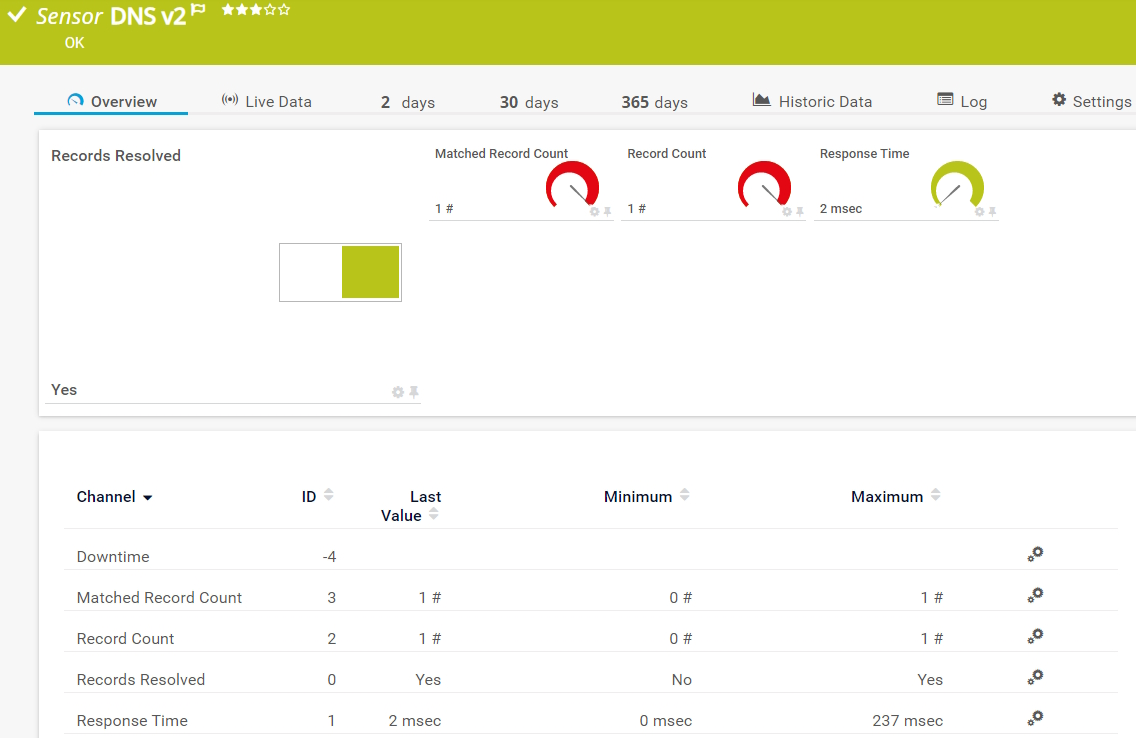
Your DNS server is down and you don’t know why? Our DNS v2 sensor monitors response times and domain name resolution so you can quickly analyze the root cause of an issue. Keep a constant eye on all your physical and virtual servers, including web servers, mail servers, cloud services, and database servers.
Use our Event Log (Windows API) or WMI Event Log sensors for detailed event log monitoring. In the event of a sudden spike in log entries – which you can filter by log files, event types, sources, messages, etc. – PRTG will send you a notification at once. It’s also possible to have PRTG read and monitor the logs of target systems such as your CDN.
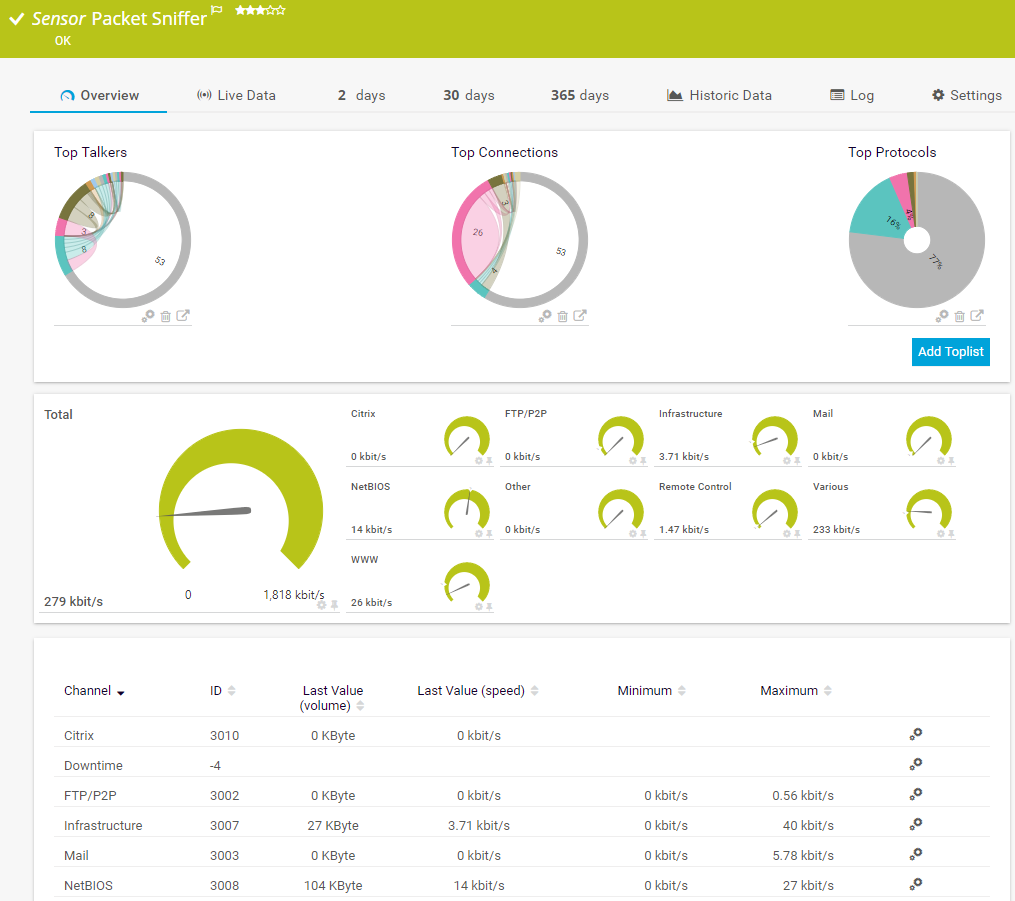
With the Packet Sniffer sensor or our various sensors for flow monitoring (NetFlow, sFlow, jFlow, and IPFIX), it’s easy to always keep an eye on bandwidth and network traffic. PRTG filters traffic data according to IP addresses, data types, data packets, and protocols to quickly get to the root of network connection problems.
PRTG comes with more than 250 native sensor types for monitoring your entire on-premises, cloud, and hybrid cloud environment out of the box. Check out some examples below!
The DNS v2 sensor monitors a Domain Name System (DNS) server, resolves domain name records, and compares them to a filter. It can show the following:
The Event Log (Windows API) sensor monitors event log entries via the Windows API. It can show the following:
The Packet Sniffer sensor monitors the headers of data packets that pass a local network card using a built-in packet sniffer. You can choose from predefined channels. It can show the following and more:
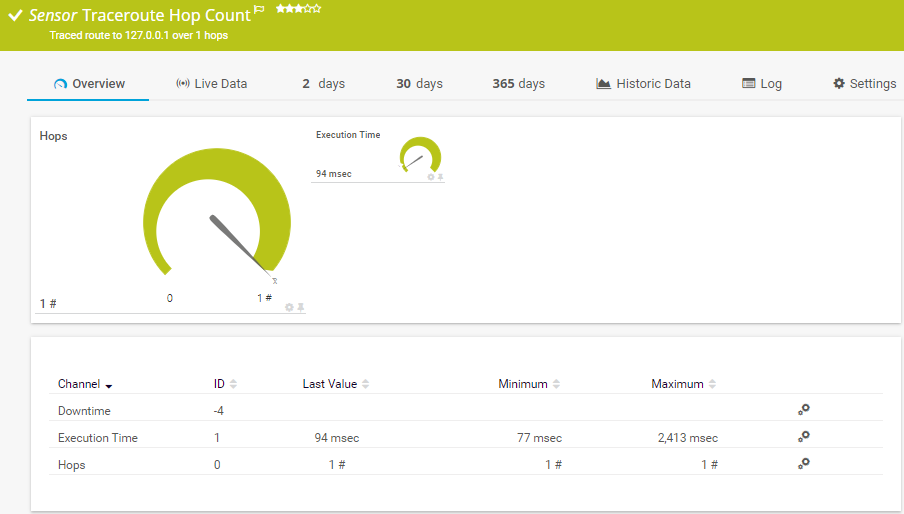
The Traceroute Hop Count sensor traces the number of hops from the probe system to the IP Address/DNS Name of the parent device. It can show the following:
See the PRTG Manual for a list of all available sensor types.

Custom alerts and data visualization let you quickly identify and prevent technical glitches and other system and performance issues.
PRTG is set up in a matter of minutes and can be used on a wide variety of mobile devices.


“Excellent tool for detailed monitoring. Alarms and notifications work greatly. Equipment addition is straight forward and server initial setup is very easy. ...feel safe to purchase it if you intend to monitor a large networking landscape.”
Partnering with innovative IT vendors, Paessler unleashes synergies to create
new and additional benefits for joined customers.

baramundi and PRTG create a secure, reliable and powerful IT infrastructure where you have everything under control - from the traffic in your firewall to the configuration of your clients.

With ScriptRunner Paessler integrates a powerful event automation platform into PRTG Network Monitor.

UVexplorer integrates tightly with PRTG to bring fast and accurate network discovery, detailed device inventory, and automatic network mapping to the PRTG platform.
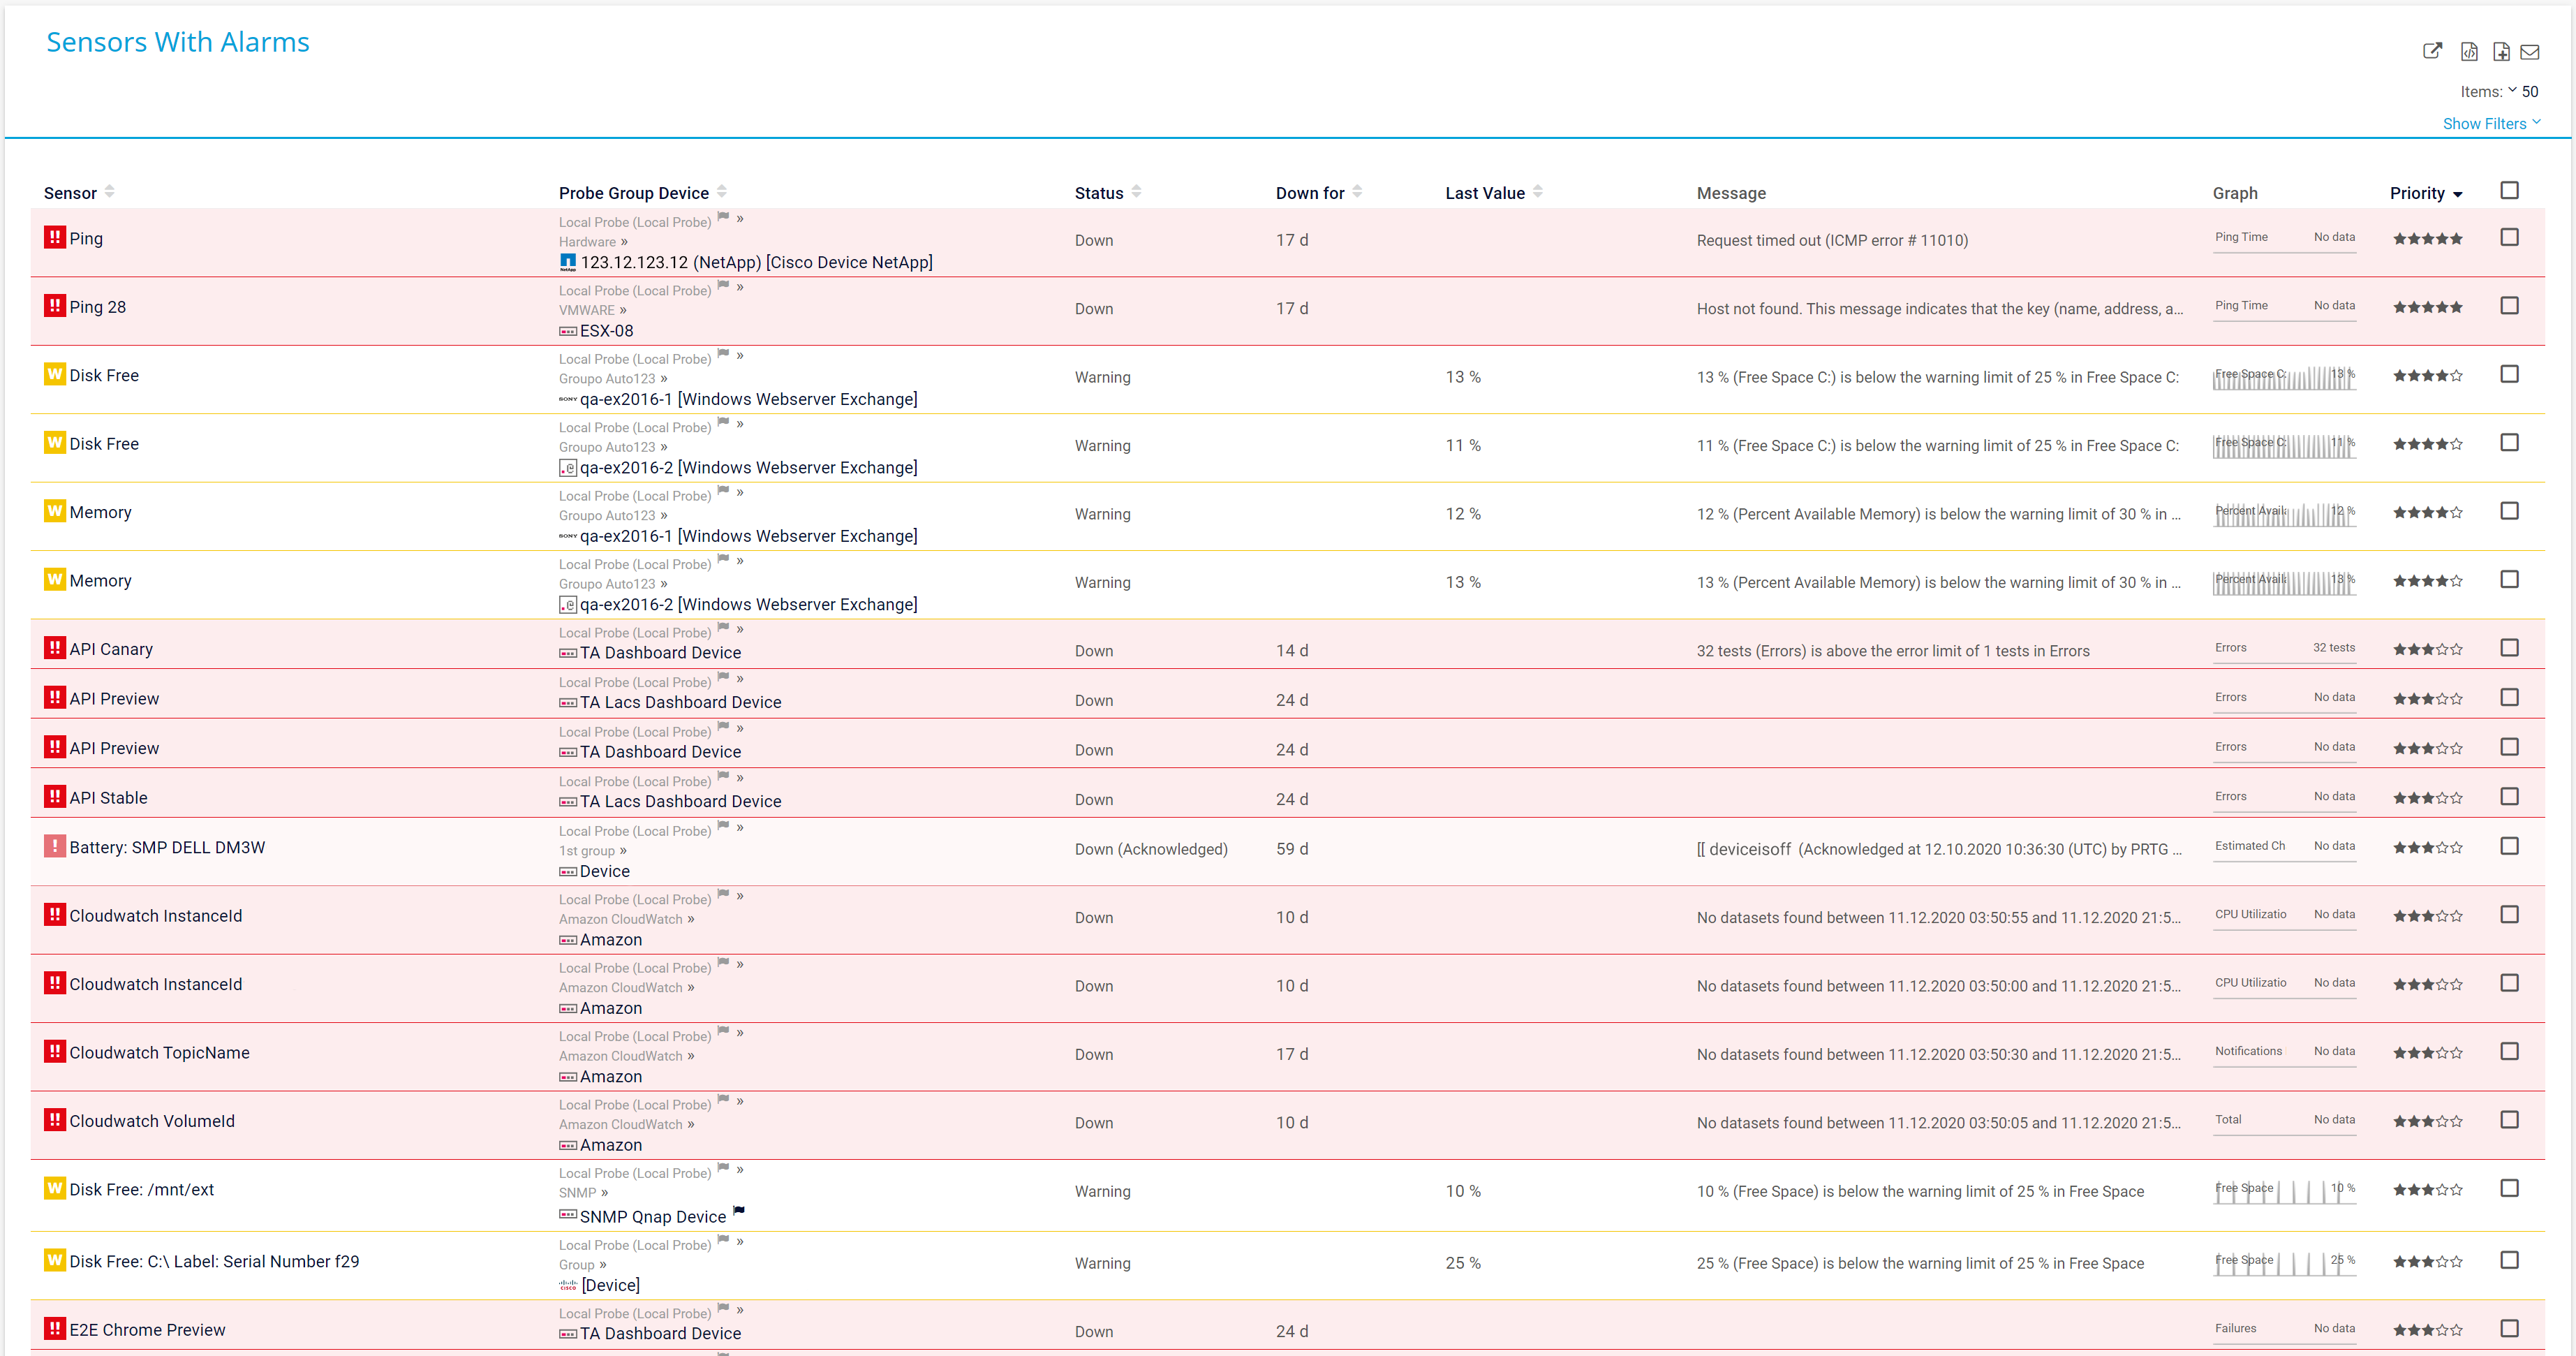
Real-time notifications mean faster troubleshooting so that you can act before more serious issues occur.
Network Monitoring Software – Version 24.4.102.1351 (November 12th, 2024)
Download for Windows and cloud-based version PRTG Hosted Monitor available
English, German, Spanish, French, Portuguese, Dutch, Russian, Japanese, and Simplified Chinese
Network devices, bandwidth, servers, applications, virtual environments, remote systems, IoT, and more
Choose the PRTG Network Monitor subscription that's best for you

PRTG is a proprietary software tool that monitors the performance and health of every component on your network. The intuitive dashboard shows you which devices, applications, web services, and other aspects of your IT infrastructure are running smoothly, and whether any are underperforming or causing issues.
You can then use a specialized diagnostic tool – many hardware manufacturers (such as HPE or Dell) and operating systems (Windows, macOS, and Linux) for instance, offer such tools out of the box – to get to the root of the problem and fix it.
A network analysis and diagnostics software like PRTG enables you to be proactive, spotting and addressing issues before they cause crashes and other serious disruptions. And because everything is monitored automatically and the data is all in one place, the process is easier and quicker. You may even discover dependencies you might not have considered before.
First you analyze, and then you diagnose. Think of it this way: Analysis is your doctor keeping an eye on your health and investigating any unusual symptoms whilst diagnosis is when they use what they've learned to identify what's causing those symptoms and formulate a treatment plan.
PRTG works in much the same way, monitoring the state of your network, alerting you when something doesn't look right, and helping you identify where the problem lies.
Network analysis involves examining relationships and connections among various elements within a system. Here are some tips to get you started:
Network analysis involves using various command-line tools to inspect, troubleshoot, and analyze networks. Here are some typical command-line prompts and their usage in network analysis:
In PRTG, “sensors” are the basic monitoring elements. One sensor usually monitors one measured value in your network, for example the traffic of a switch port, the CPU load of a server, or the free space on a disk drive. On average, you need about 5-10 sensors per device or one sensor per switch port.
Paessler conducted trials in over 600 IT departments worldwide to tune its network monitoring software closer to the needs of sysadmins. The result of the survey: over 95% of the participants would recommend PRTG – or already have.

Paessler PRTG is used by companies of all sizes. Sysadmins love PRTG because it makes their job a whole lot easier.
Bandwidth, servers, virtual environments, websites, VoIP services – PRTG keeps an eye on your entire network.
Everyone has different monitoring needs. That’s why we let you try PRTG for free.