Custom alerts and data visualizations let you quickly identify and prevent packet loss, network congestion, latency, jitter, and other connectivity problems.
Struggling with spotty VoIP calls, slow transfer speeds, and connection failures?
Getting more bandwidth isn't necessarily the answer. How you're using the available network bandwidth is just as important if you want your Wi-Fi network to run smoothly.
With Paessler PRTG, you can see exactly which hardware components and software applications on your wireless network are the most bandwidth-hungry at any point in time. This will help you make short work of bottlenecks, manage bandwidth utilization, and distribute your resources more effectively.
Instead of spending more money for even more bandwidth, just make the most out of the resources you already have.
Nobody likes to spend multiple hours or even days with the setup of their new monitoring environment. With PRTG, you’ll get it up and running in minutes, with minimal tweaking (or hair-tearing).
Pick your preferred IP address range and the auto-discovery will add every device and application in that range, assign the appropriate sensors, and start tracking WiFi usage. That’s it.
How does the idea sound to have a complete picture of your network bandwidth usage at your fingertips? PRTG's preconfigured, out-of-the-box sensors monitor every application, device, and process on your wireless network.
Pinpoint exactly where your network traffic is going, which components are underperforming as a result, and where you should direct your attention in your search for the culprit.
Managing your network bandwidth is easy… when you have the right data and use the best bandwidth monitoring tools. Raise the curtain for PRTG: it tracks usage across your entire IT infrastructure in real time, enabling you to make adjustments on the fly.
Plus, you’ll get automated alerts the second your network’s at risk of exceeding capacity, so you can start troubleshooting right away.
Spot patterns and trends and make better-informed decisions about your network’s capacity. Over time, monitoring WiFi bandwidth with PRTG creates historical data, which gives you a better view of usage peaks and bandwidth hogs.
This way, you can plan ahead more easily and make more efficient use of your resources.
Diagnose network issues by continuously tracking the performance of your wireless network. Show router health, throughput, connection quality, and other key metrics in real time. Visualize monitoring data in clear graphs and dashboards to identify problems more easily. Gain the overview you need to troubleshoot all kinds of WiFi bandwidth issues.
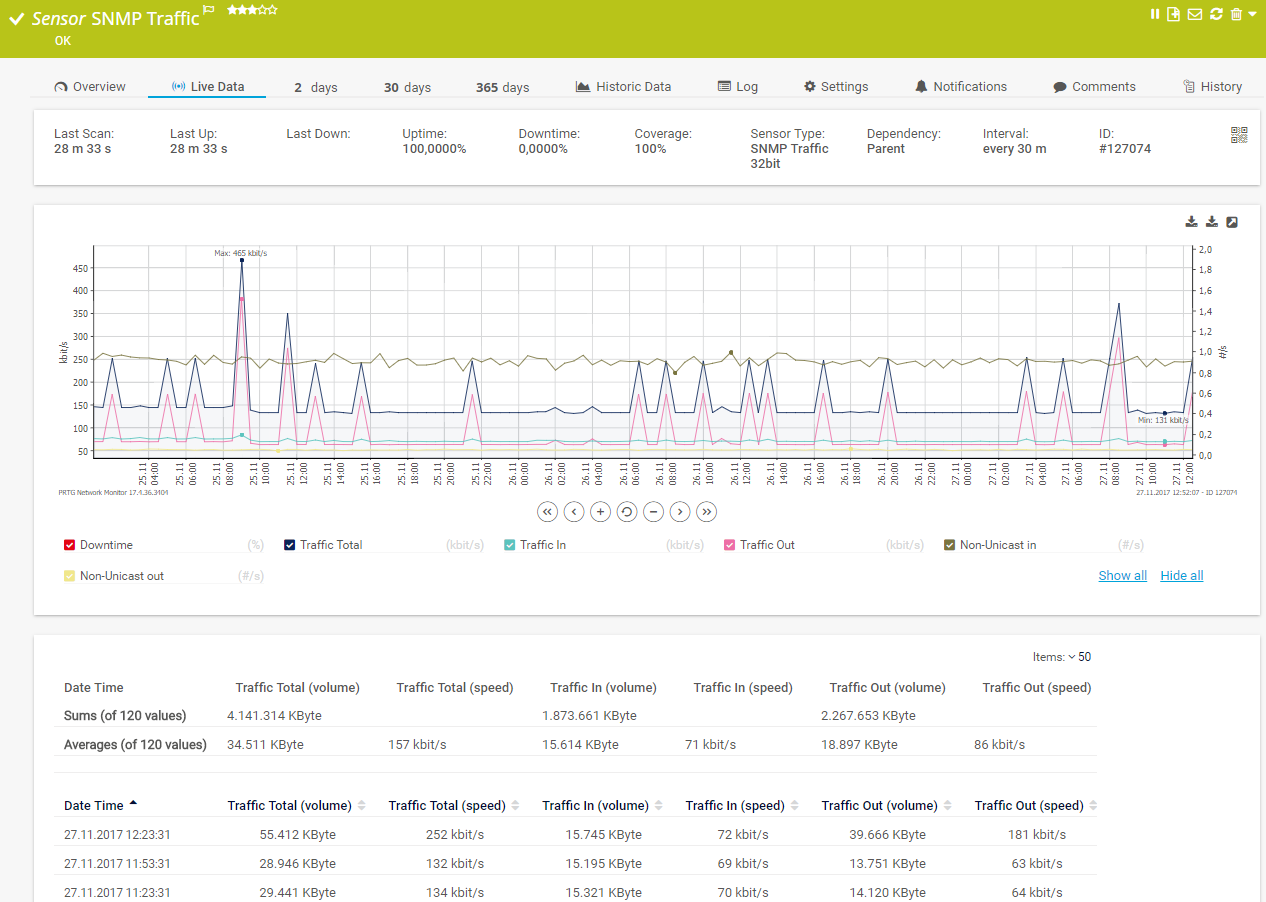
Live traffic data graph in PRTG
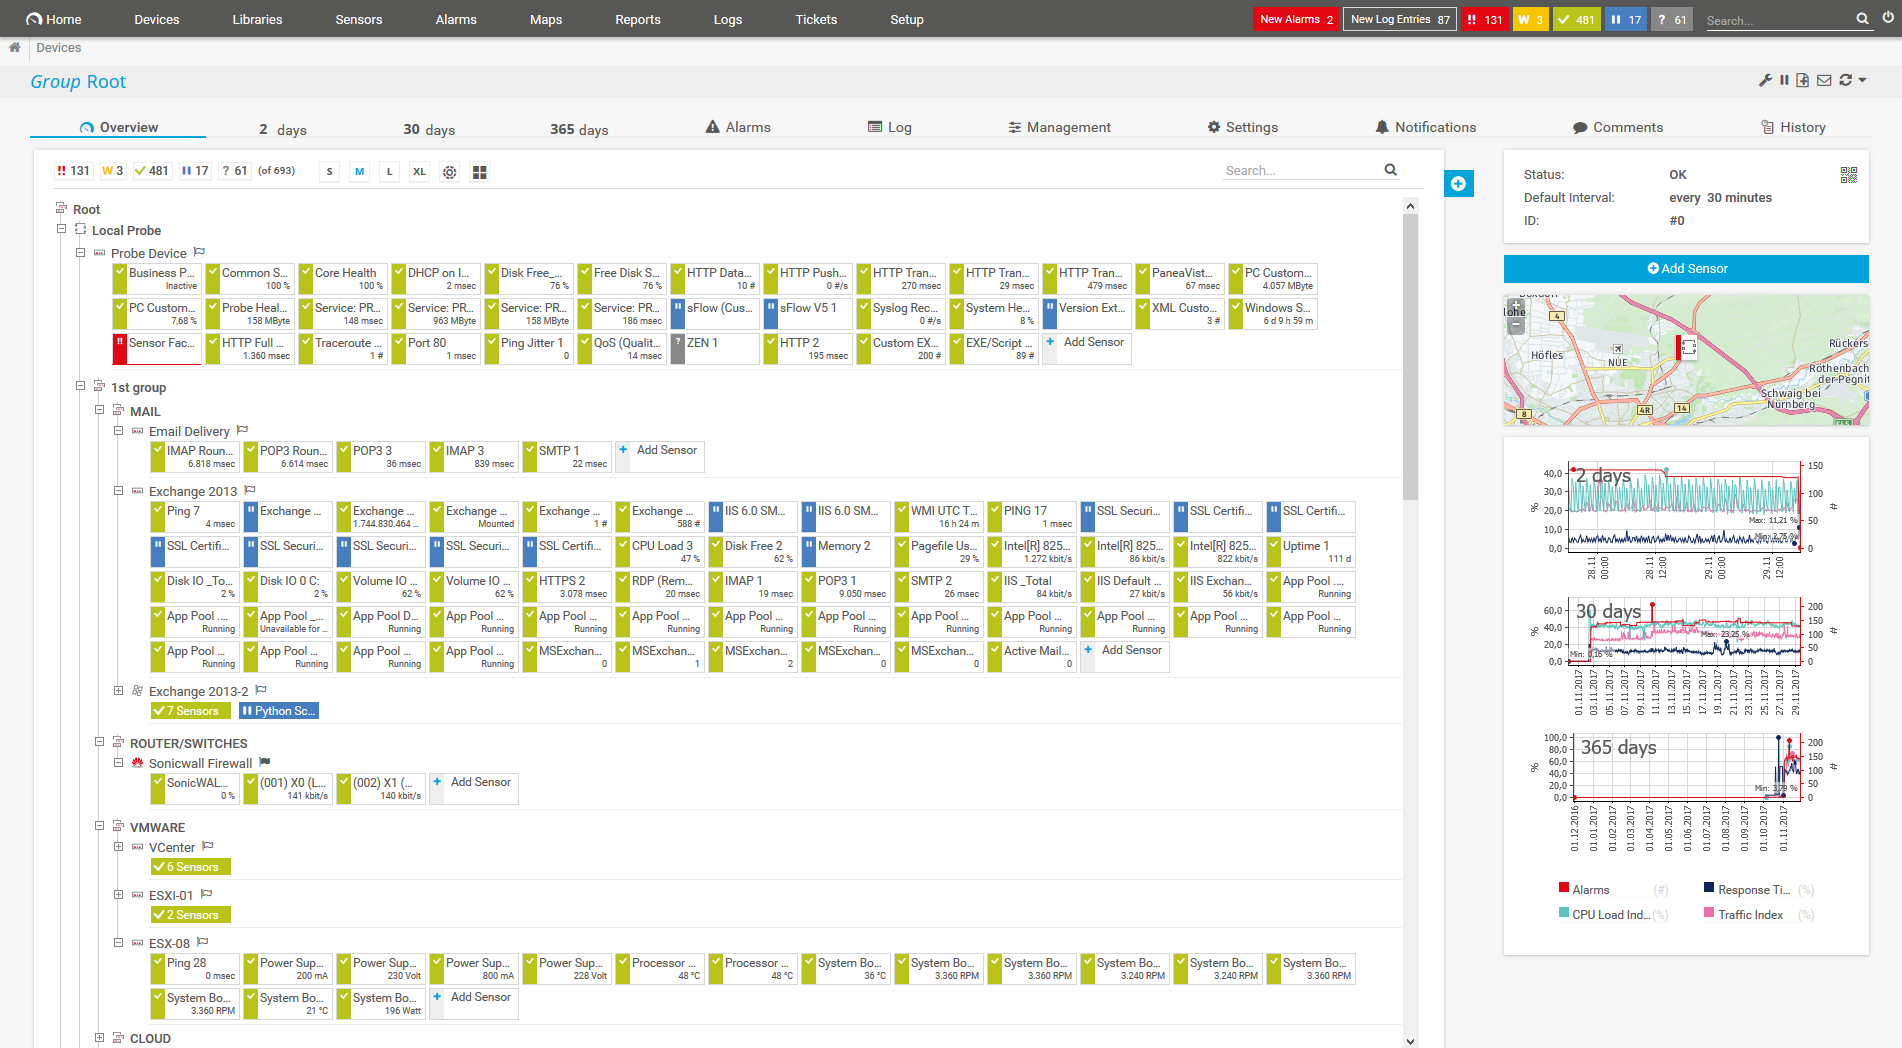
Device tree view of the complete monitoring setup
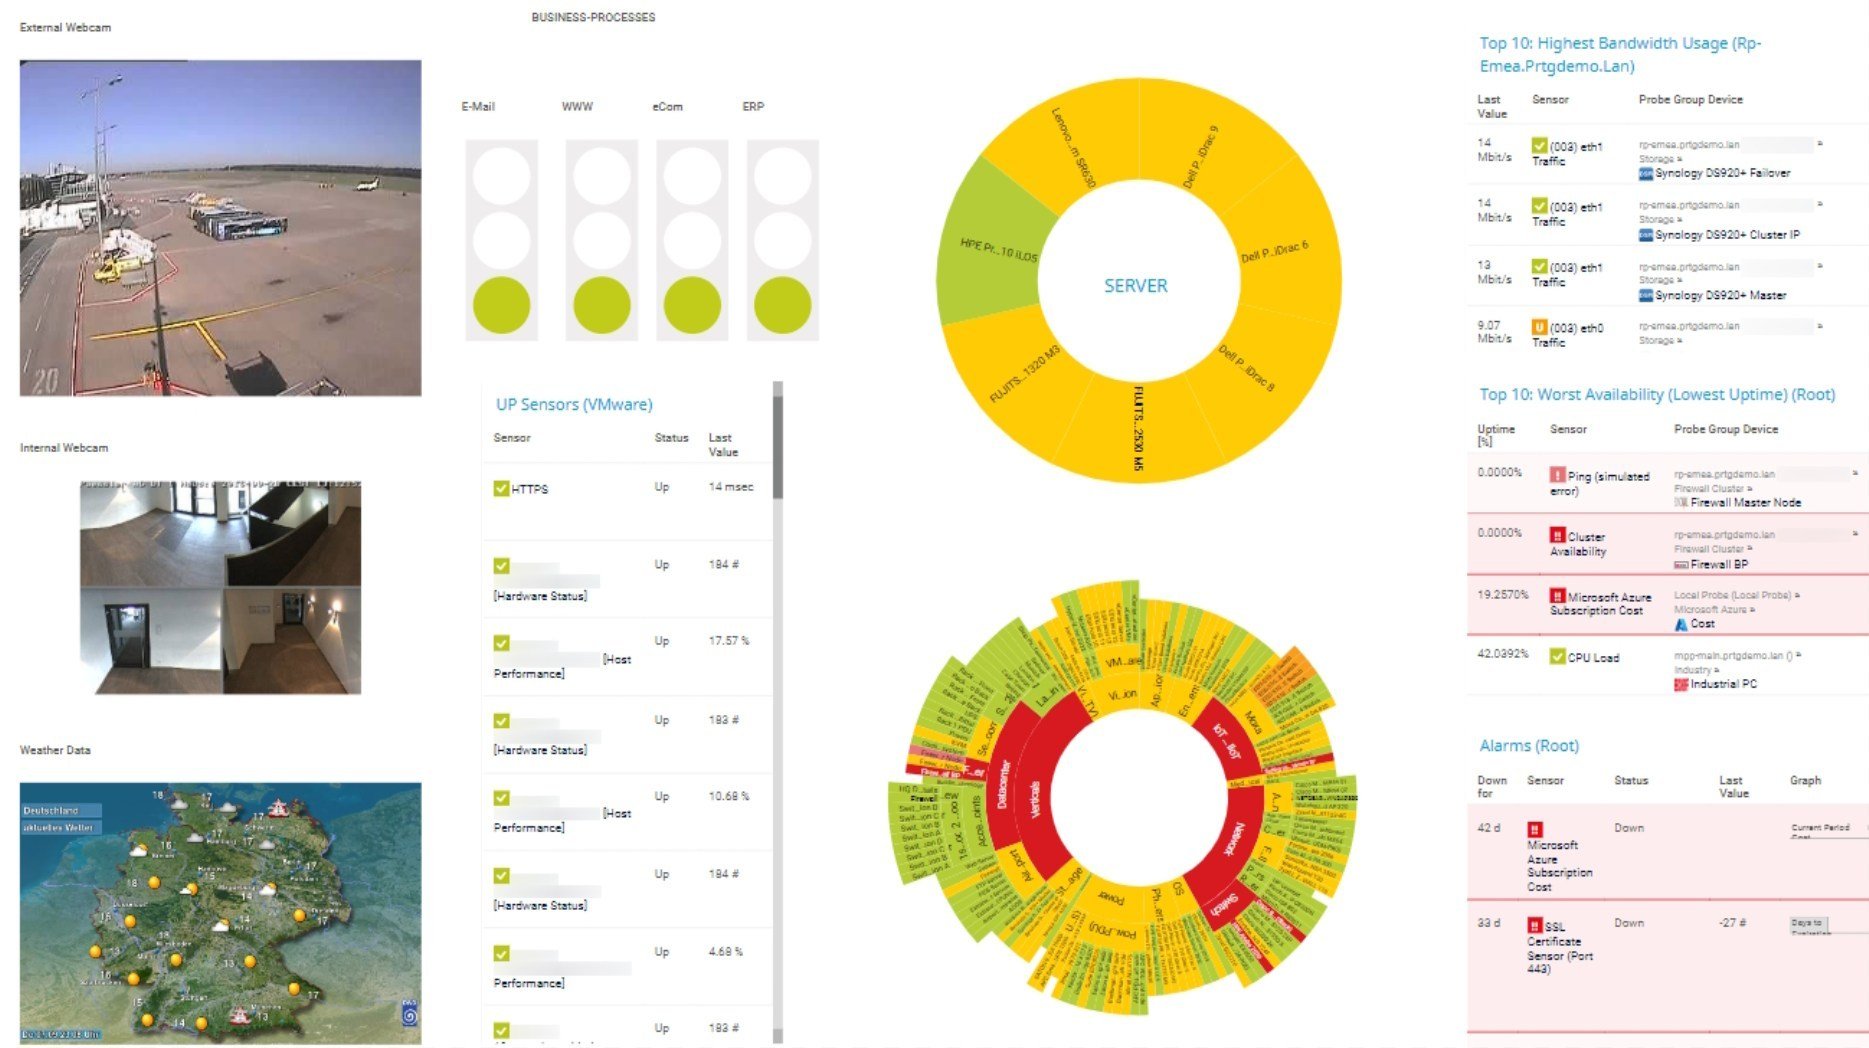
Custom PRTG dashboard for keeping an eye on the entire IT infrastructure

Live traffic data graph in PRTG

Device tree view of the complete monitoring setup
PRTG gives network administrators access to powerful functionality that allows you to monitor bandwidth usage and much more across your entire network. You’ll be as fast as the roadrunner in finding the root cause of bandwidth bottlenecks. Track every variable that could possibly impact your bandwidth, including:
PRTG’s more than 250 preconfigured sensor types support monitoring via SNMP, WMI, Windows performance counters, flow technologies (including NetFlow, sFlow, IPFIX, and jFlow) SSH, HTTP and HTTPS, and more.
Real-time notifications mean faster troubleshooting so that you can act before more serious issues occur.
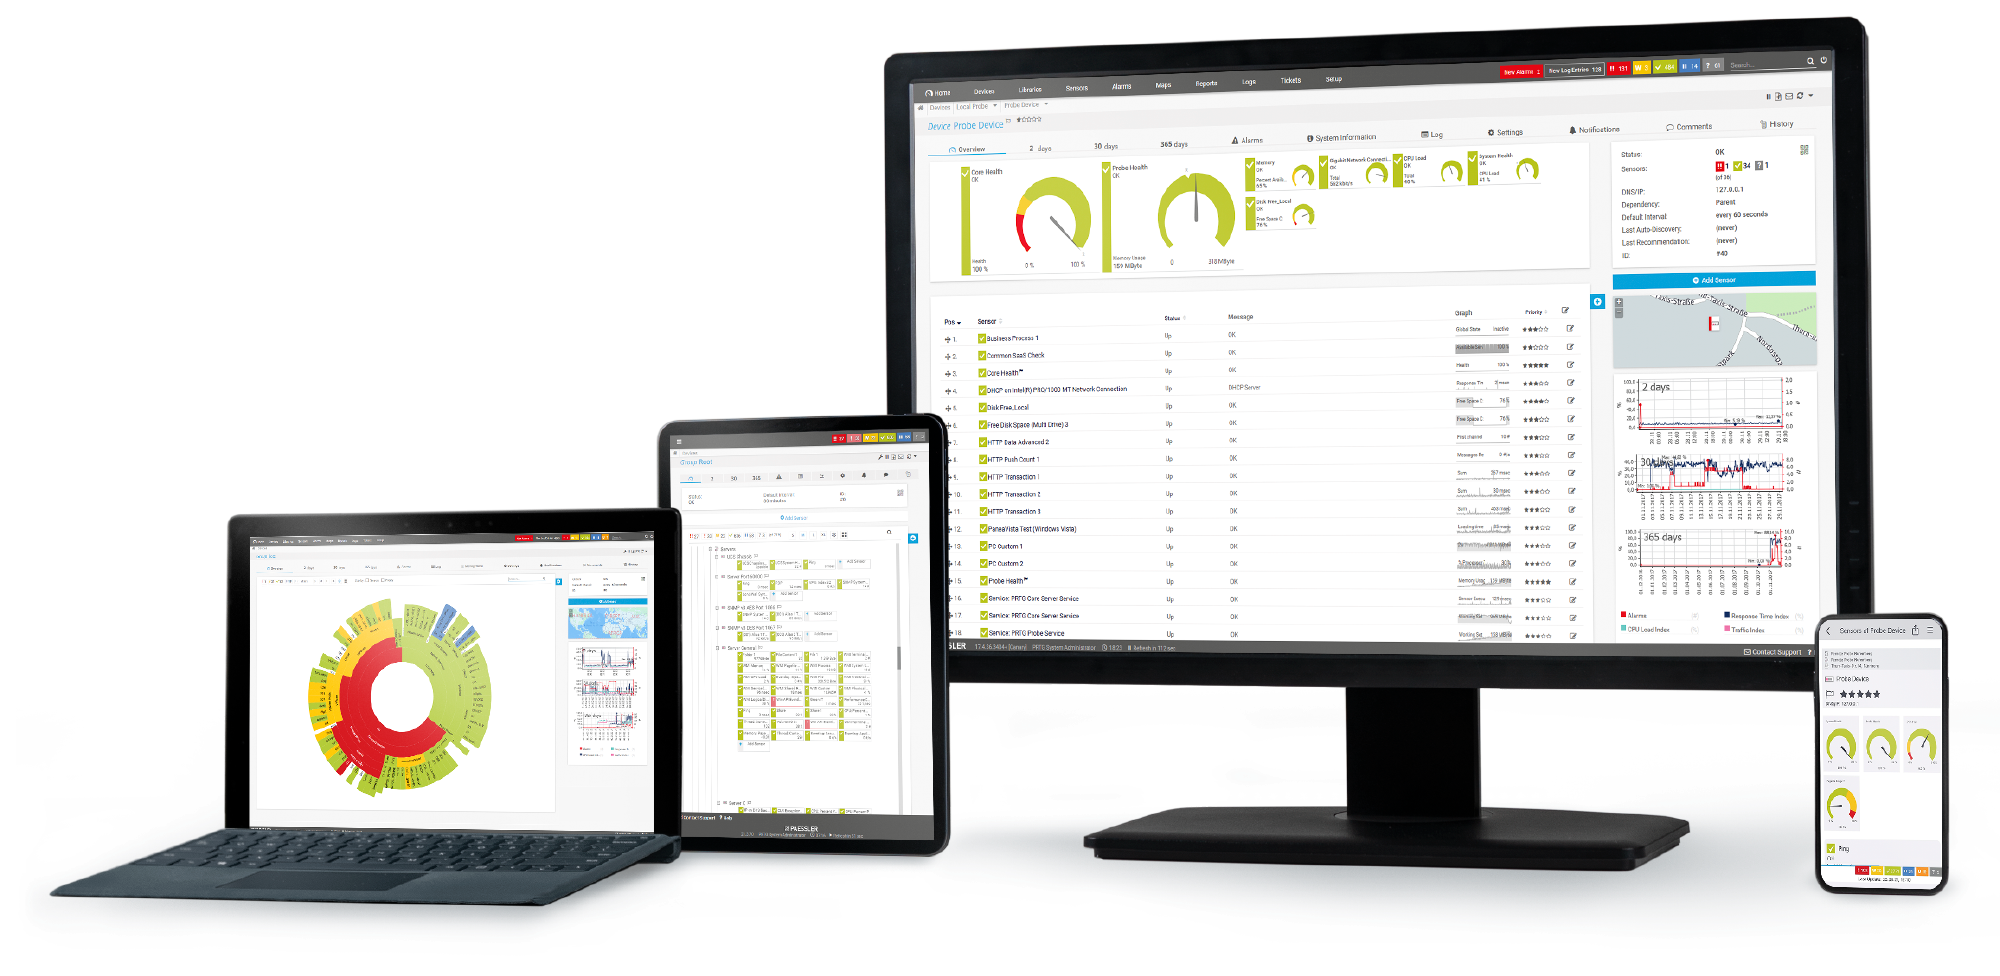
Set up PRTG in minutes and use it on almost any mobile device.
“Excellent tool for detailed monitoring. Alarms and notifications work greatly. Equipment addition is straight forward and server initial setup is very easy. ...feel safe to purchase it if you intend to monitor a large networking landscape.”
Partnering with innovative IT vendors, Paessler unleashes synergies to create
new and additional benefits for joined customers.
Integrating monitoring results from PRTG into NetBrain maps makes the foundation for network automation.
IT that works constitutes a business-critical basis for a company's success. Availability and security must be defined for the respective purpose and closely monitored – by OT and IT alike.

With ScriptRunner Paessler integrates a powerful event automation platform into PRTG Network Monitor.
Custom alerts and data visualizations let you quickly identify and prevent packet loss, network congestion, latency, jitter, and other connectivity problems.
Network Monitoring Software – Version 24.4.102.1351 (November 12th, 2024)
Download for Windows and cloud-based version PRTG Hosted Monitor available
English, German, Spanish, French, Portuguese, Dutch, Russian, Japanese, and Simplified Chinese
Network devices, bandwidth, servers, applications, virtual environments, remote systems, IoT, and more
Choose the PRTG Network Monitor subscription that's best for you
In enterprise networks, bandwidth is how much data can be transferred between two endpoints in a given time frame. It's typically measured in megabits per second (Mbps) or, more and more, in gigabits per second (Gbit/s).
Higher bandwidth means your network can handle more data more quickly, which contributes to greater speed, stability, and reliability. When bandwidth is low, your network can slow down or become unstable. It may also not be able to support all the network devices, applications, and other components your organization needs to operate effectively.
While bandwidth monitoring involves tracking the total amount of data transferred across a network, WiFi bandwidth usage monitoring specifically focuses on the data that’s being transferred over wireless connections. Unlike wired connections, wireless networks can be affected by additional factors like signal strength, interference, or the number of connected devices. Wi-Fi bandwidth monitoring helps identify these specific issues and provides insights into how your wireless network is performing and where improvements can or should be made to maintain consistent and reliable connectivity.
Wi-Fi bandwidth monitoring means tracking how much data your wireless network is processing, while Wi-Fi bandwidth management means controlling and optimizing the available bandwidth for wireless connections. Think of it this way: if your Wi-Fi network were a highway, monitoring would be traffic cameras, and management would be traffic flow measures such as bus lanes, speed limits, and traffic lights.
Both are critical if you want to manage your Wi-Fi network effectively. Wi-Fi bandwidth monitoring shows you how much bandwidth is being used and which devices are your top talkers. Wi-Fi bandwidth management is the process of assessing traffic patterns and whether bandwidth usage suits your needs and, if not, prioritizing where it should go.
PRTG network monitoring software monitors all your Wi-Fi devices and access points round the clock, enabling you to see exactly how much bandwidth specific software, hardware, or other components are using at any point in time. Better still, it alerts you if Wi-Fi bandwidth consumption goes above a predetermined threshold, so you can adjust on the fly, before your network's performance starts to suffer. With the powerful combination of real-time Wi-Fi traffic monitoring and advanced Wi-Fi traffic analysis, you can make sure that your wireless network stays optimized and stable.
In PRTG, “sensors” are the basic monitoring elements. One sensor usually monitors one measured value in your network, for example the traffic of a switch port, the CPU load of a server, or the free space on a disk drive. On average, you need about 5-10 sensors per device or one sensor per switch port.
Paessler conducted trials in over 600 IT departments worldwide to tune its network monitoring software closer to the needs of sysadmins. The result of the survey: over 95% of the participants would recommend PRTG – or already have.
Paessler PRTG is used by companies of all sizes. Sysadmins love PRTG because it makes their job a whole lot easier.
Bandwidth, servers, virtual environments, websites, VoIP services – PRTG keeps an eye on your entire network.
Everyone has different monitoring needs. That’s why we let you try PRTG for free.