Custom alerts and data visualization let you quickly identify and prevent slow-performing web servers and web applications.
Your online presence is important, and so is the hardware and software it runs on: your web server. To make sure your infrastructure delivers optimal performance and remains reliable, you need a comprehensive monitoring software. Paessler PRTG provides you with the insights and control you need to maintain high performance, minimize downtime, and optimize end-user experience.
Welcome to PRTG's performance monitoring – the security agency for your web server, minus the whole controversy. This digital special agent gets the goods on the most important factors to a smooth operation.
Memory allocation, throughput, and I/O operations are all prime suspects and kept under close watch. Our customizable dashboards make watching these questionable factors a simple matter.
Sometimes it can feel like you need a crystal ball to run your network. PRTG acts as a dedicated team of “digital psychics” for your IT infrastructure – our software analyzes critical metrics such as server health, disk usage, and response time.
And when your performance thresholds are crossed, alerts you instantly. This quick heads-up lets you respond in record time, squashing issues before they get out of hand.
Slow web servers are digital snail races – briefly amusing before users flee in boredom. Enter PRTG, your server's support in the sprint against impatience.
When your server shows any indication of performance issues, PRTG helps diagnose whether it's HTTP gridlock, data processing, or webpage delivery failures. You end up with a web server that delivers content quickly, keeping users on your page longer than their attention spans typically allow.
Turn your raw metrics into visual clarity. PRTG's intuitive, customizable dashboards are a window into your web server's inner workings and turn monitoring data into a feast for your analytical mind.
With a glance, you can diagnose your web server's health and performance quickly. Whether you're tracking response times or hunting for hidden resource hogs, PRTG's visualizations make complex data simple to understand and react to.
Diagnose network issues by continuously tracking the availability, health, and performance of your web servers and other endpoints. Show uptime, load times, bandwidth utilization, latency, the number of requests, disk space, and other key metrics in real time. Visualize monitoring data in clear graphs and dashboards to identify problems more easily. Gain the overview you need to troubleshoot slow-performing web servers and prevent bottlenecks and outages.
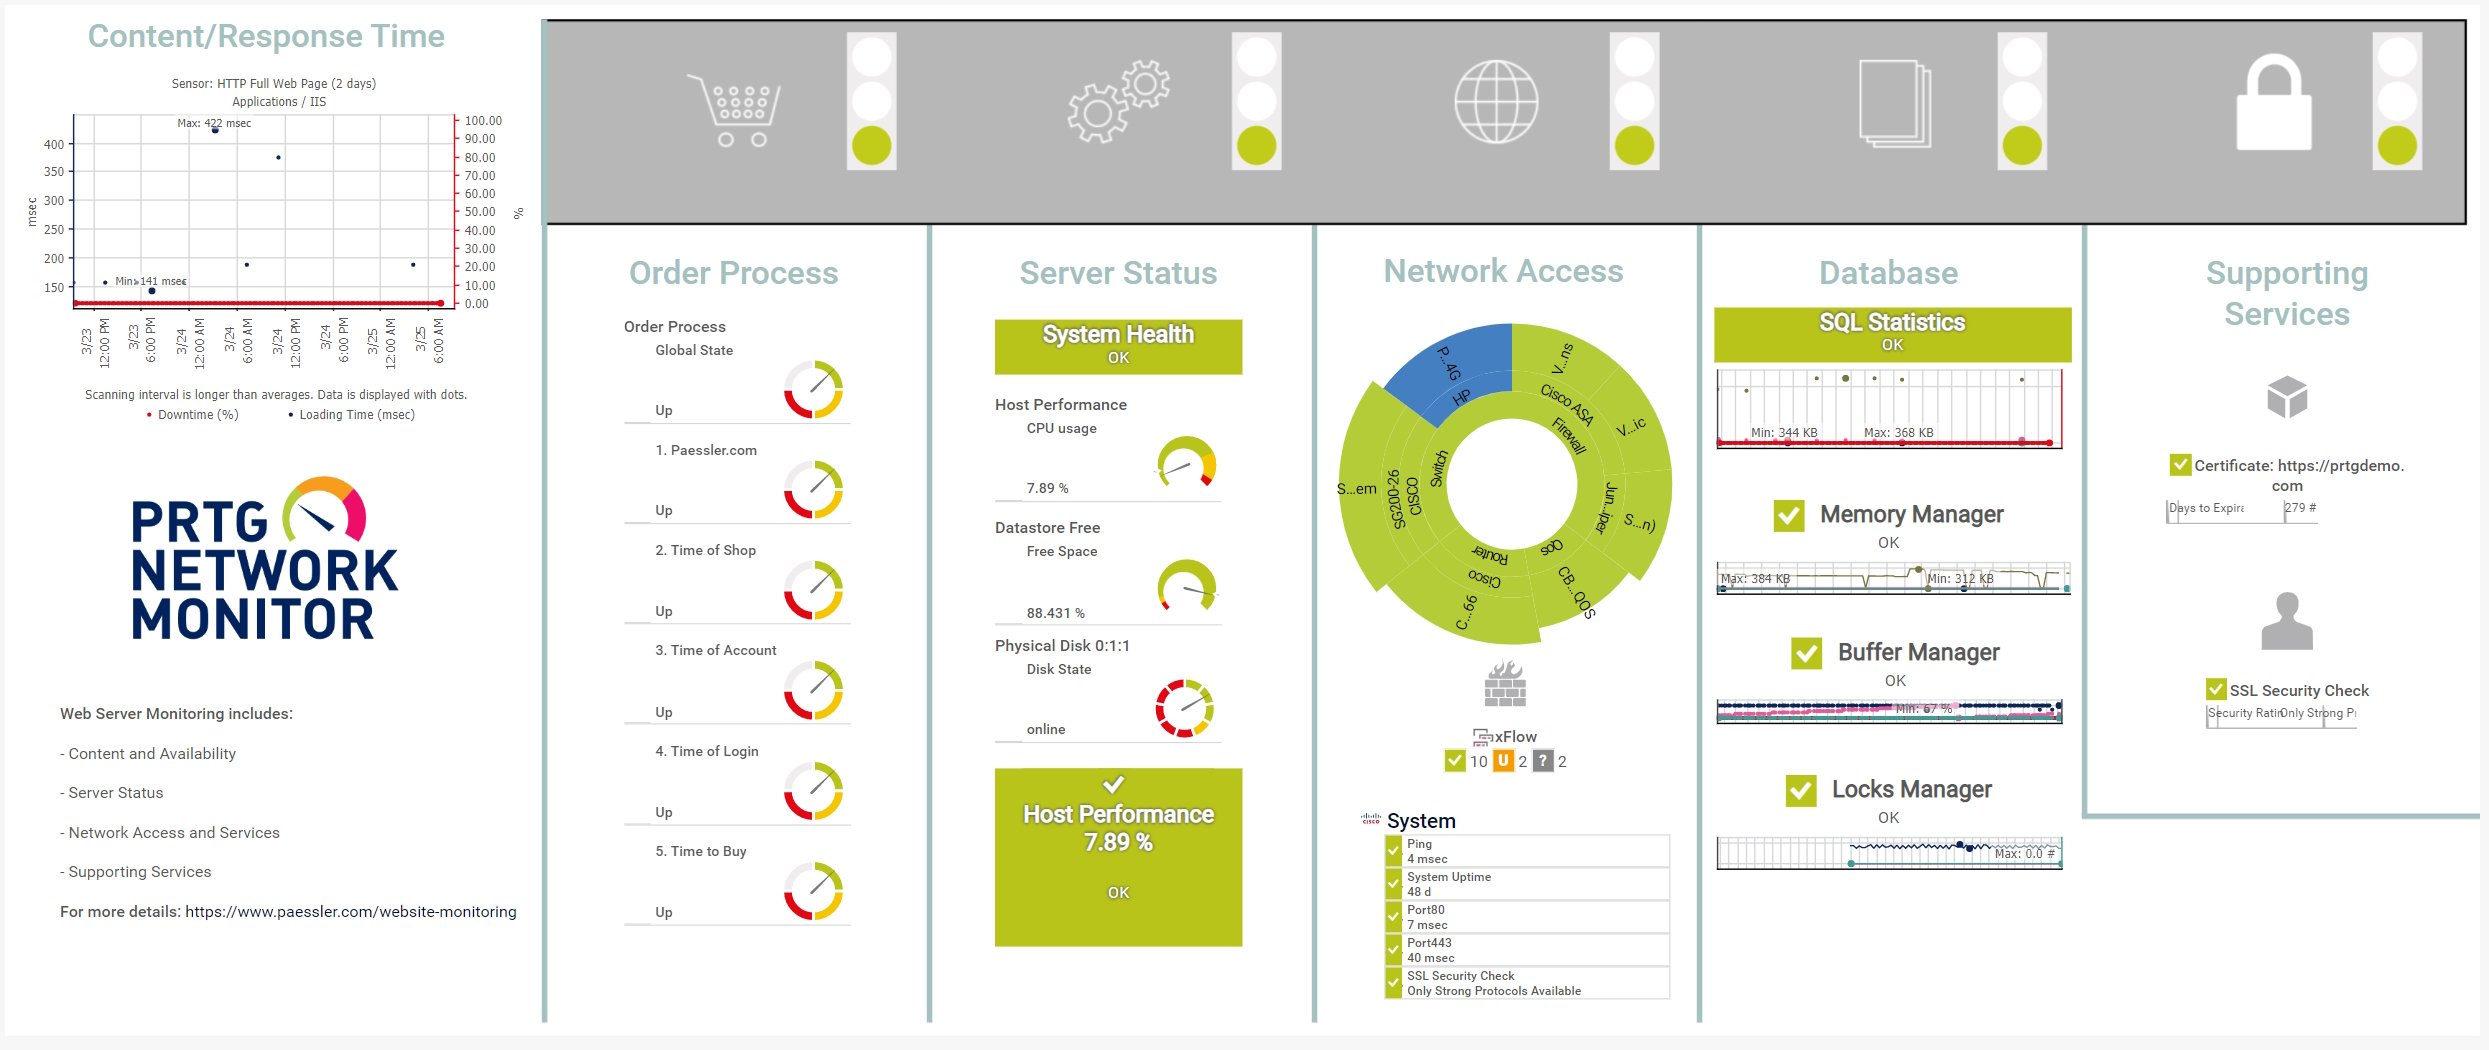
Web server website monitoring map in PRTG
Custom PRTG dashboard for web servers

Device tree view of the complete monitoring setup

Custom PRTG dashboard for keeping an eye on the entire IT infrastructure
Web server website monitoring map in PRTG
Custom PRTG dashboard for web servers
“All-around winning
network monitor”
“The real beauty of PRTG is the endless possibilities it offers”
“PRTG Network Monitor
is very hard to beat”
PRTG comes with more than 250 native sensor types for monitoring your entire on-premises, cloud, and hybrid cloud environment out of the box. Check out some examples below!
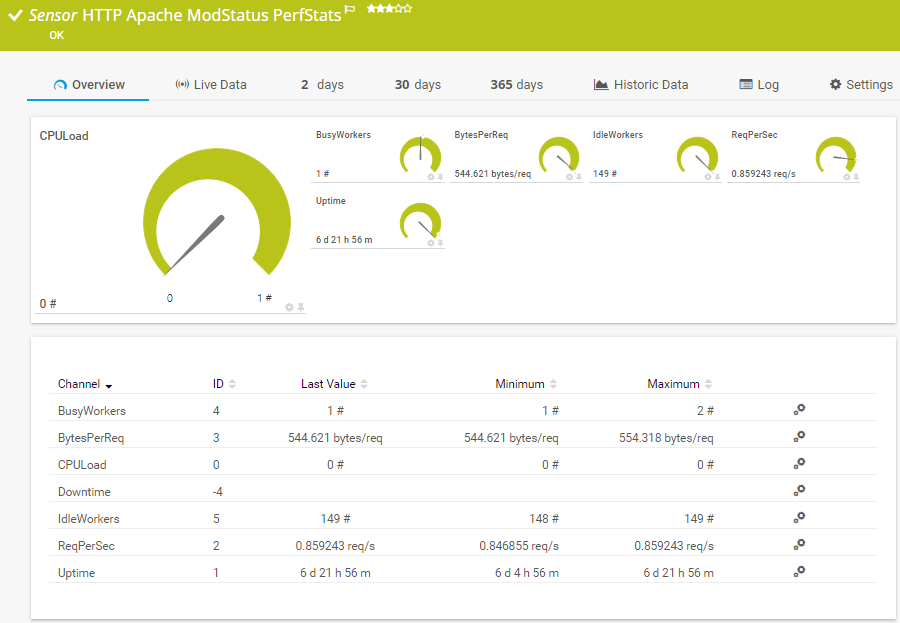
The HTTP Apache ModStatus PerfStats sensor monitors performance statistics of an Apache web server via mod_status over HTTP. It can show the following:
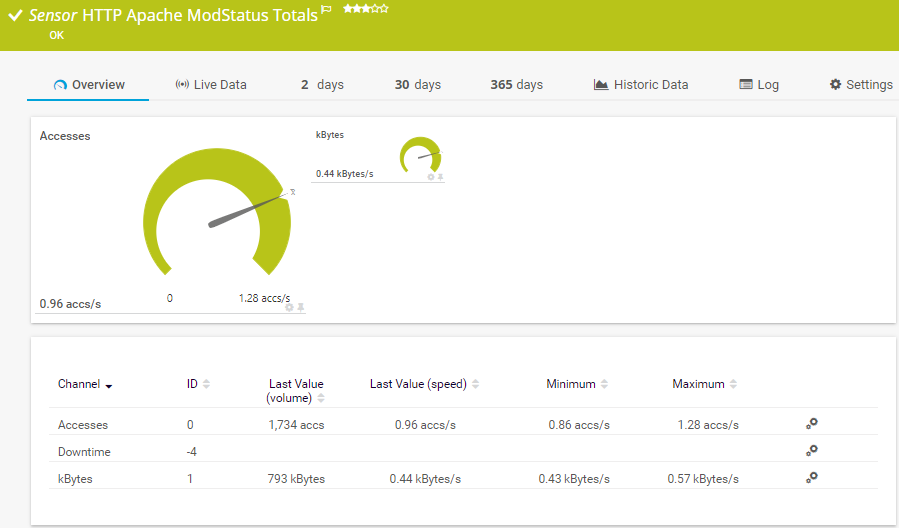
The HTTP Apache ModStatus Totals sensor monitors the activity of an Apache web server using mod_status over HTTP. It can show the following:
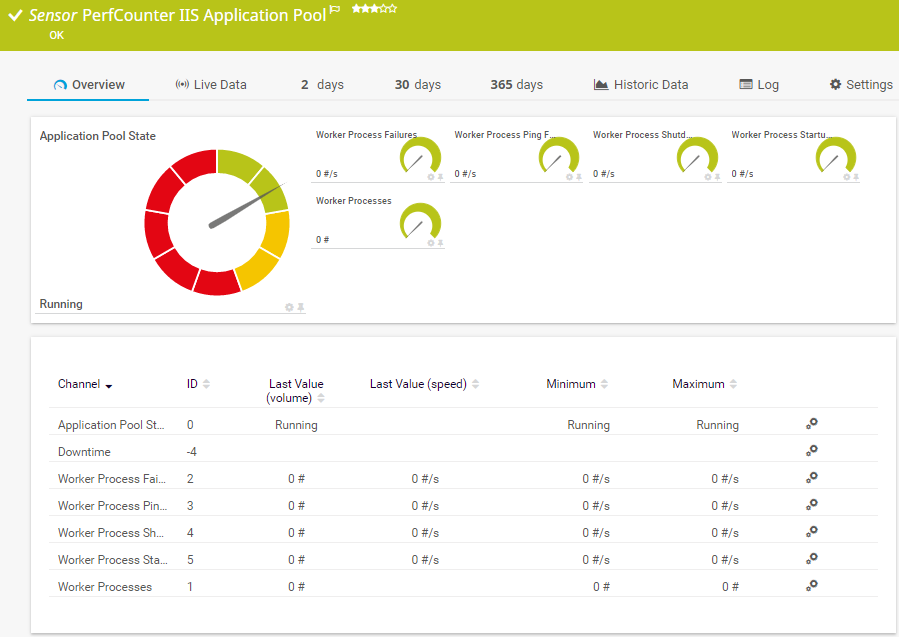
The PerfCounter IIS Application Pool sensor monitors a Microsoft Internet Information Services (IIS) application pool via Windows performance counters. It can show the following:
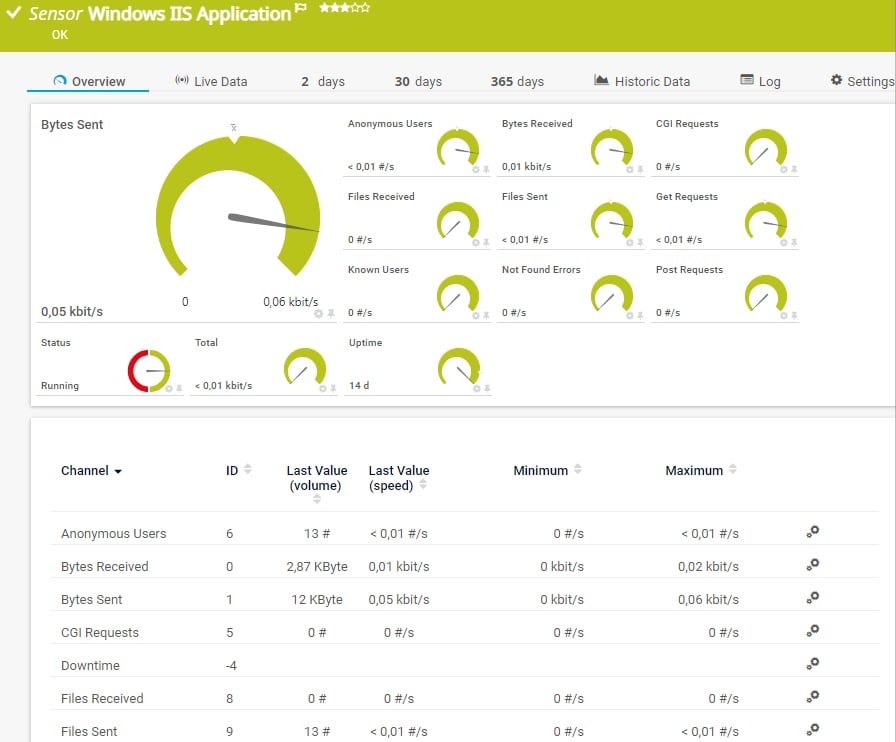
The Windows IIS Application sensor monitors a Microsoft Internet Information Services (IIS) server via Windows Management Instrumentation (WMI). It can also monitor applications that use IIS, such as Microsoft SharePoint or Microsoft Reporting Services (SSRS). It can show the following and more:
See the PRTG Manual for a list of all available sensor types.

Custom alerts and data visualization let you quickly identify and prevent slow-performing web servers and web applications.
PRTG is set up in a matter of minutes and can be used on a wide variety of mobile devices.


“Excellent tool for detailed monitoring. Alarms and notifications work greatly. Equipment addition is straight forward and server initial setup is very easy. ...feel safe to purchase it if you intend to monitor a large networking landscape.”
Partnering with innovative IT vendors, Paessler unleashes synergies to create
new and additional benefits for joined customers.
IT that works constitutes a business-critical basis for a company's success. Availability and security must be defined for the respective purpose and closely monitored – by OT and IT alike.
Integrating monitoring results from PRTG into NetBrain maps makes the foundation for network automation.

With ScriptRunner Paessler integrates a powerful event automation platform into PRTG Network Monitor.
Real-time notifications mean faster troubleshooting so that you can act before more serious issues occur.
Network Monitoring Software – Version 24.4.102.1351 (November 12th, 2024)
Download for Windows and cloud-based version PRTG Hosted Monitor available
English, German, Spanish, French, Portuguese, Dutch, Russian, Japanese, and Simplified Chinese
Network devices, bandwidth, servers, applications, virtual environments, remote systems, IoT, and more
Choose the PRTG Network Monitor subscription that's best for you


A web server is a system—typically a combination of software and hardware—that delivers web content to users over the internet. Its primary role is to respond to requests made by web browsers (or clients) by serving up web pages and resources like images, videos, or files. Components of a web server include:
Web server performance monitoring is the process of continuously tracking and analyzing the performance, health, and availability of web servers to ensure they function properly and efficiently. It involves using monitoring tools like Paessler PRTG and techniques to detect potential issues, like downtime, slow response times, or resource overload, before they negatively impact users or the business. Monitored metrics include:
Monitoring web server performance is essential for ensuring the availability, reliability, and efficiency of websites or web-based applications. Here are the key reasons why it’s important:
Yes! PRTG offers comprehensive monitoring for a wide range of web server applications, including Apache, Nginx, IIS, and more. Whether you’re running on Windows, Linux, or a mixed environment, PRTG provides the flexibility to monitor all key metrics relevant to your web server’s performance.
Absolutely. PRTG is fully equipped to monitor web servers hosted on cloud platforms like AWS, Azure, and more. It can track performance metrics, uptime, and response time for both cloud and on-premises servers, providing a unified view of your entire infrastructure.
Yes, PRTG enables remote monitoring of your web server’s performance. With mobile apps and secure web access, you can keep an eye on your server’s health and receive alerts no matter where you are. This ensures you stay informed about any potential issues, even when you’re not on-site.
In PRTG, “sensors” are the basic monitoring elements. One sensor usually monitors one measured value in your network, for example the traffic of a switch port, the CPU load of a server, or the free space on a disk drive. On average, you need about 5-10 sensors per device or one sensor per switch port.
Paessler conducted trials in over 600 IT departments worldwide to tune its network monitoring software closer to the needs of sysadmins. The result of the survey: over 95% of the participants would recommend PRTG – or already have.

Paessler PRTG is used by companies of all sizes. Sysadmins love PRTG because it makes their job a whole lot easier.
Bandwidth, servers, virtual environments, websites, VoIP services – PRTG keeps an eye on your entire network.
Everyone has different monitoring needs. That’s why we let you try PRTG for free.