


Custom alerts and data visualization let you quickly identify and prevent bandwidth bottlenecks, unplanned network downtime, and other performance issues.
PRTG gives you an overview of every possible source of errors, including servers, computers, routers, and switches of any manufacturer or vendor. Just pick your preferred warning and error thresholds, and if a network devices malfunctions, you’ll be alerted at once.
PRTG automatically alerts you to errors in your network so you can take action at once. No alert, no worries: if you haven’t received a notification, then you can be sure your system is running smoothly. Plus, you can choose to get alerts by SMS, email, push notification, and more.
Getting down to the root causes of network errors can be time-consuming. PRTG helps you isolate problems faster by letting you immediately exclude potential causes. A more thorough analysis – often done with additional tools – will help you explore the error in detail.
PRTG monitors your network 24/7. Long-term monitoring and historical data makes it easier to put a finger on the causes of recurring problems. Meanwhile, PRTG reports help you explain problems to your managers, who may have less IT expertise than yourself.
Diagnose network issues by continuously tracking disruptions, downtime, and other network problems. Show response times, uptime, latency, CPU usage, bandwidth utilization, network connectivity, and other key metrics in real time. Visualize monitoring data in clear graphs and dashboards to identify problems more easily. Gain the overview you need to troubleshoot critical network events and improve overall network health.

Live traffic data graph in PRTG
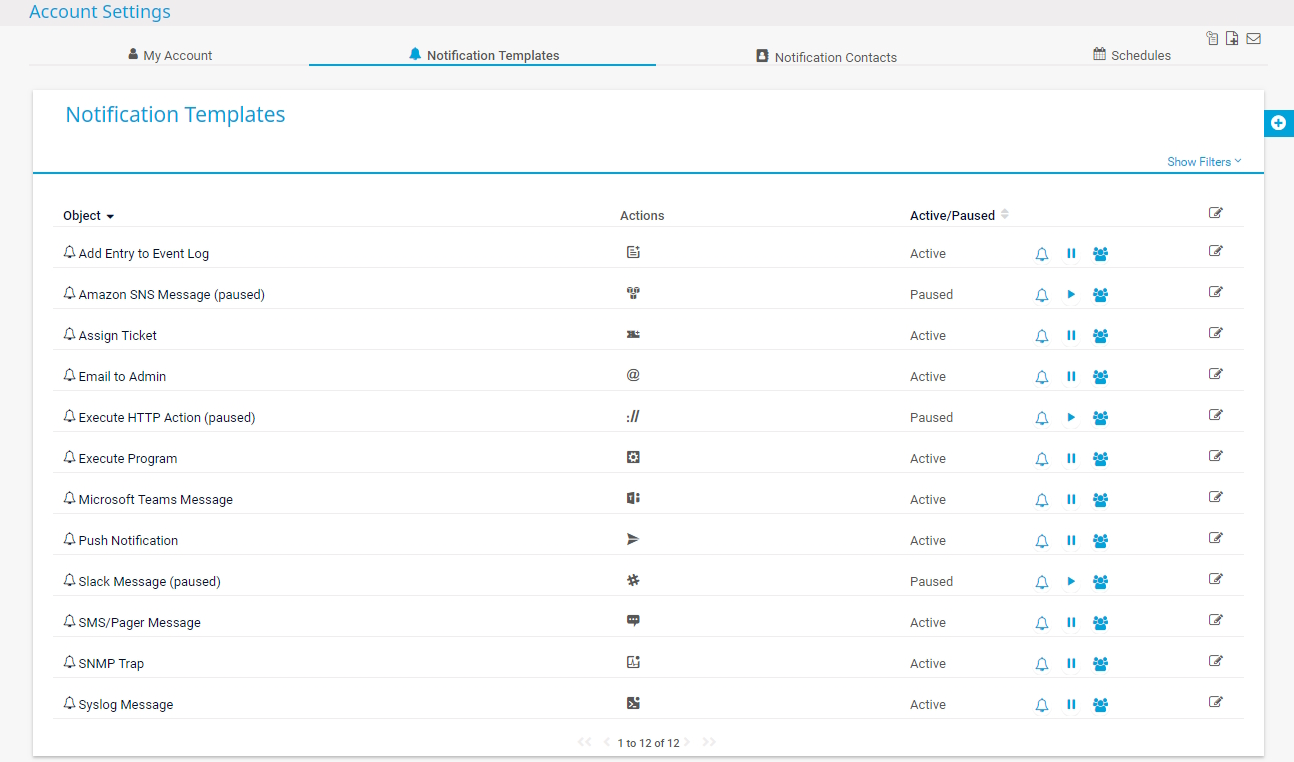
Notification methods in PRTG
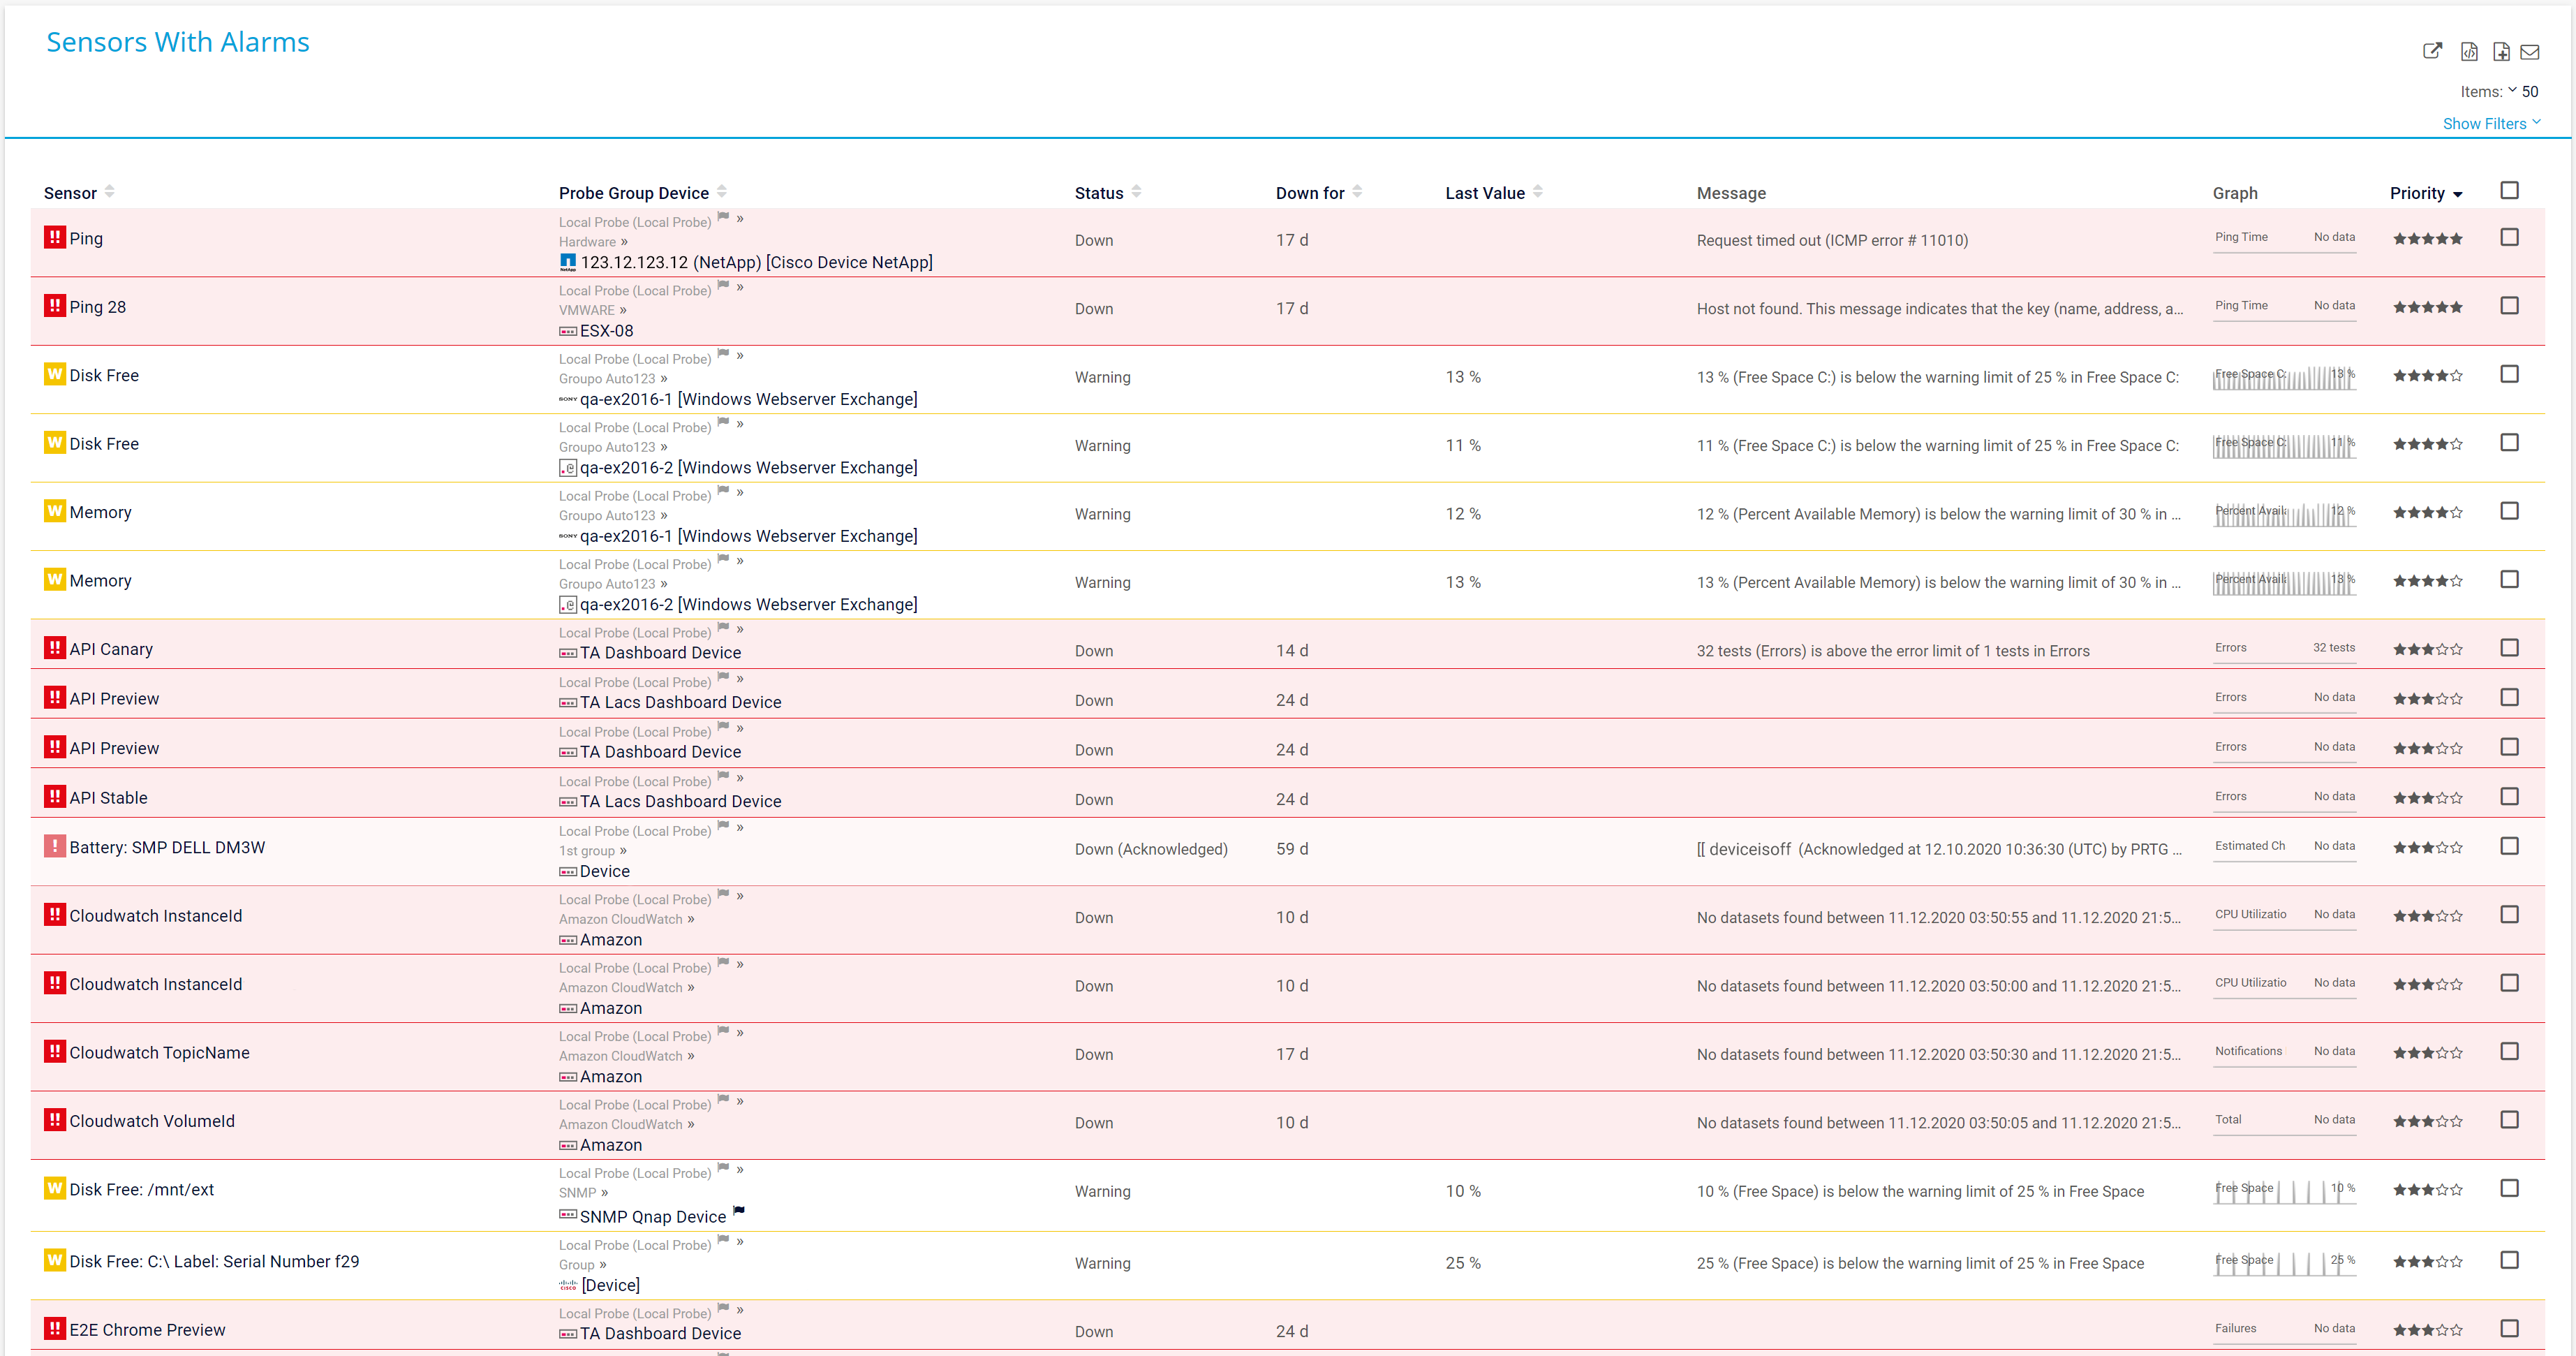
Alarm overview sensors in PRTG
Notification methods in PRTG

Custom PRTG dashboard for keeping an eye on the entire IT infrastructure
Live traffic data graph in PRTG
Notification methods in PRTG
“All-around winning
network monitor”
“The real beauty of PRTG is the endless possibilities it offers”
“PRTG Network Monitor
is very hard to beat”
PRTG automatically sets up initial ping monitoring during installation. Ping sensors display the availability of all network devices, including routers and switches which can cause bottlenecks. This can help you more quickly detect the source of errors.
Is an error or malfunction affecting your database servers, web servers, or mail servers? PRTG monitors your servers around the clock, so you’ll be notified quickly in the event of a server crash or failure.
Your connections keep going down – but you have no idea why. Our SNMP sensors provide an immediate overview of your network traffic, while packet sniffing allows for a more in-depth analyses. And with our QoS sensors, you can even monitor quality of service.

Real-time notifications mean faster troubleshooting so that you can act before more serious issues occur.
PRTG is set up in a matter of minutes and can be used on a wide variety of mobile devices.

Partnering with innovative IT vendors, Paessler unleashes synergies to create
new and additional benefits for joined customers.

Paessler and Plixer provide a complete solution adding flow and metadata analysis to a powerful network monitoring tool.
IT that works constitutes a business-critical basis for a company's success. Availability and security must be defined for the respective purpose and closely monitored – by OT and IT alike.

Siemon and Paessler bring together intelligent building technology and advanced monitoring and make your vision of intelligent buildings and data centers become reality.
Custom alerts and data visualization let you quickly identify and prevent bandwidth bottlenecks, unplanned network downtime, and other performance issues.
Network Monitoring Software – Version 25.1.104.1946 (March 18th, 2025)
Download for Windows and cloud-based version PRTG Hosted Monitor available
English, German, Spanish, French, Portuguese, Dutch, Russian, Japanese, and Simplified Chinese
Network devices, bandwidth, servers, applications, virtual environments, remote systems, IoT, and more
Choose the PRTG Network Monitor subscription that's best for you


There are many different ways to say “network error.” Besides “error,” you might find “bug,” “fault,” or “failure.” It all depends on whether the term is being used by a system administrator, software developer, or software tester.
Network error
Countless errors occur in every network. Here are some examples of error codes for network problems: 400, 1106, 410, 503, 410, and 503. Depending on the severity of the error, the sysadmin may be required to take action at once. On the other hand, in the world of software development, an “error” occurs when a developer makes a mistake because of a misjudgment or misunderstanding.
Network fault
Sysadmins consider “faults” as general network errors that lead to a malfunction or crash. Fault network management was created to combat such errors. In software development, a “fault” is seen as an anomaly in code that leads to an error.
“Network management” encompasses any task that an IT manager performs with regard to their network infrastructure, and includes error, configuration, invoice, performance, and security management. There are open-source as well as proprietary tools for each of these tasks. The right network management system depends, among other things, on the size of the network and the demands of the IT manager.
The term “IT fault management” is used in a broader context. It involves identifying, diagnosing, and evaluating errors in network operations. These errors can include program errors, operating errors, or certain human errors. IT fault management is used to come up with measures for keeping errors to a minimum. Network monitoring plays an important role in this process.
"Network monitoring” is a passive way of monitoring a network. Sensors automatically monitor the hardware, applications, and traffic in your network. If a malfunction or a critical error occurs, an alert is sent immediately so the IT manager can take action at once. A network monitoring tool like PRTG saves time, prevents crashes, and lets sysadmins focus on other important tasks.
Network fault management is a critical aspect of network management that focuses on identifying, diagnosing, and resolving network issues to ensure seamless performance. The benefits of effective network fault management include:
In PRTG, “sensors” are the basic monitoring elements. One sensor usually monitors one measured value in your network, for example the traffic of a switch port, the CPU load of a server, or the free space on a disk drive. On average, you need about 5-10 sensors per device or one sensor per switch port.
Paessler conducted trials in over 600 IT departments worldwide to tune its network monitoring software closer to the needs of sysadmins. The result of the survey: over 95% of the participants would recommend PRTG – or already have.

Paessler PRTG is used by companies of all sizes. Sysadmins love PRTG because it makes their job a whole lot easier.
Bandwidth, servers, virtual environments, websites, VoIP services – PRTG keeps an eye on your entire network.
Everyone has different monitoring needs. That’s why we let you try PRTG for free.

