Custom alerts and data visualizations make it easy to monitor, identify, and prevent bottlenecks, server overload, latency, connectivity and capacity problems, and other website performance issues.
5 seconds.
Less than it takes to reheat your coffee in the break room microwave, or for the elevator door to close.
And yet, a whopping 90% of website visitors will be up in arms if your website takes longer than this to load.
But it's not just your website loading time that's make or break.
Excessive background API calls, inefficient database queries, no auto-scalability, unused CSS, poorly-written javascript, and other issues can also impact performance.
And, because these issues are often not noticeable at normal loads, they might go undetected until an unexpected spike in traffic brings everything crashing down.
PRTG's website load tester helps you get in front of these issues by enabling you to check whether web pages will perform as expected under normal conditions, and at which point you'll start running into issues.
Better still, you can keep a close eye on key metrics round the clock, and built-in automations will alert you in case of potentially problematic anomalies so you can nip them in the bud.

Don't wait for your website to go down before you fix it. Pick your preferred performance thresholds and PRTG will email, text, or send an in-app notification on your mobile app if it detects a potential issue. Which means you'll have fewer annoyed colleagues (and customers) and more sales.
Make sure your website is available wherever you have customers, at all times. PRTG supports worldwide testing and monitoring, so you can check that it's live in America, Africa, Asia, Europe, Oceania… and yes, in Antarctica too.
Testing and monitoring you won't outgrow. PRTG supports unlimited local, remote, and virtual devices, enabling you to expand or reduce your monitoring capabilities as your needs change. Oh, and we won't lock you in or try to upsell you stuff you don't need.
Diagnose network issues by continuously tracking applications, databases, CPUs, firewalls, DNS, web servers, cloud services, and other critical website components. Show traffic, throughput, memory, load time, response times and other key metrics in real time. Visualize monitoring data in clear graphs and dashboards to identify problems more easily. Gain the overview you need to troubleshoot bottlenecks, server overload, latency, connectivity and capacity problems, and other website performance issues.

Live traffic data graph in PRTG
PRTG map for website monitoring

Device tree view of the complete monitoring setup

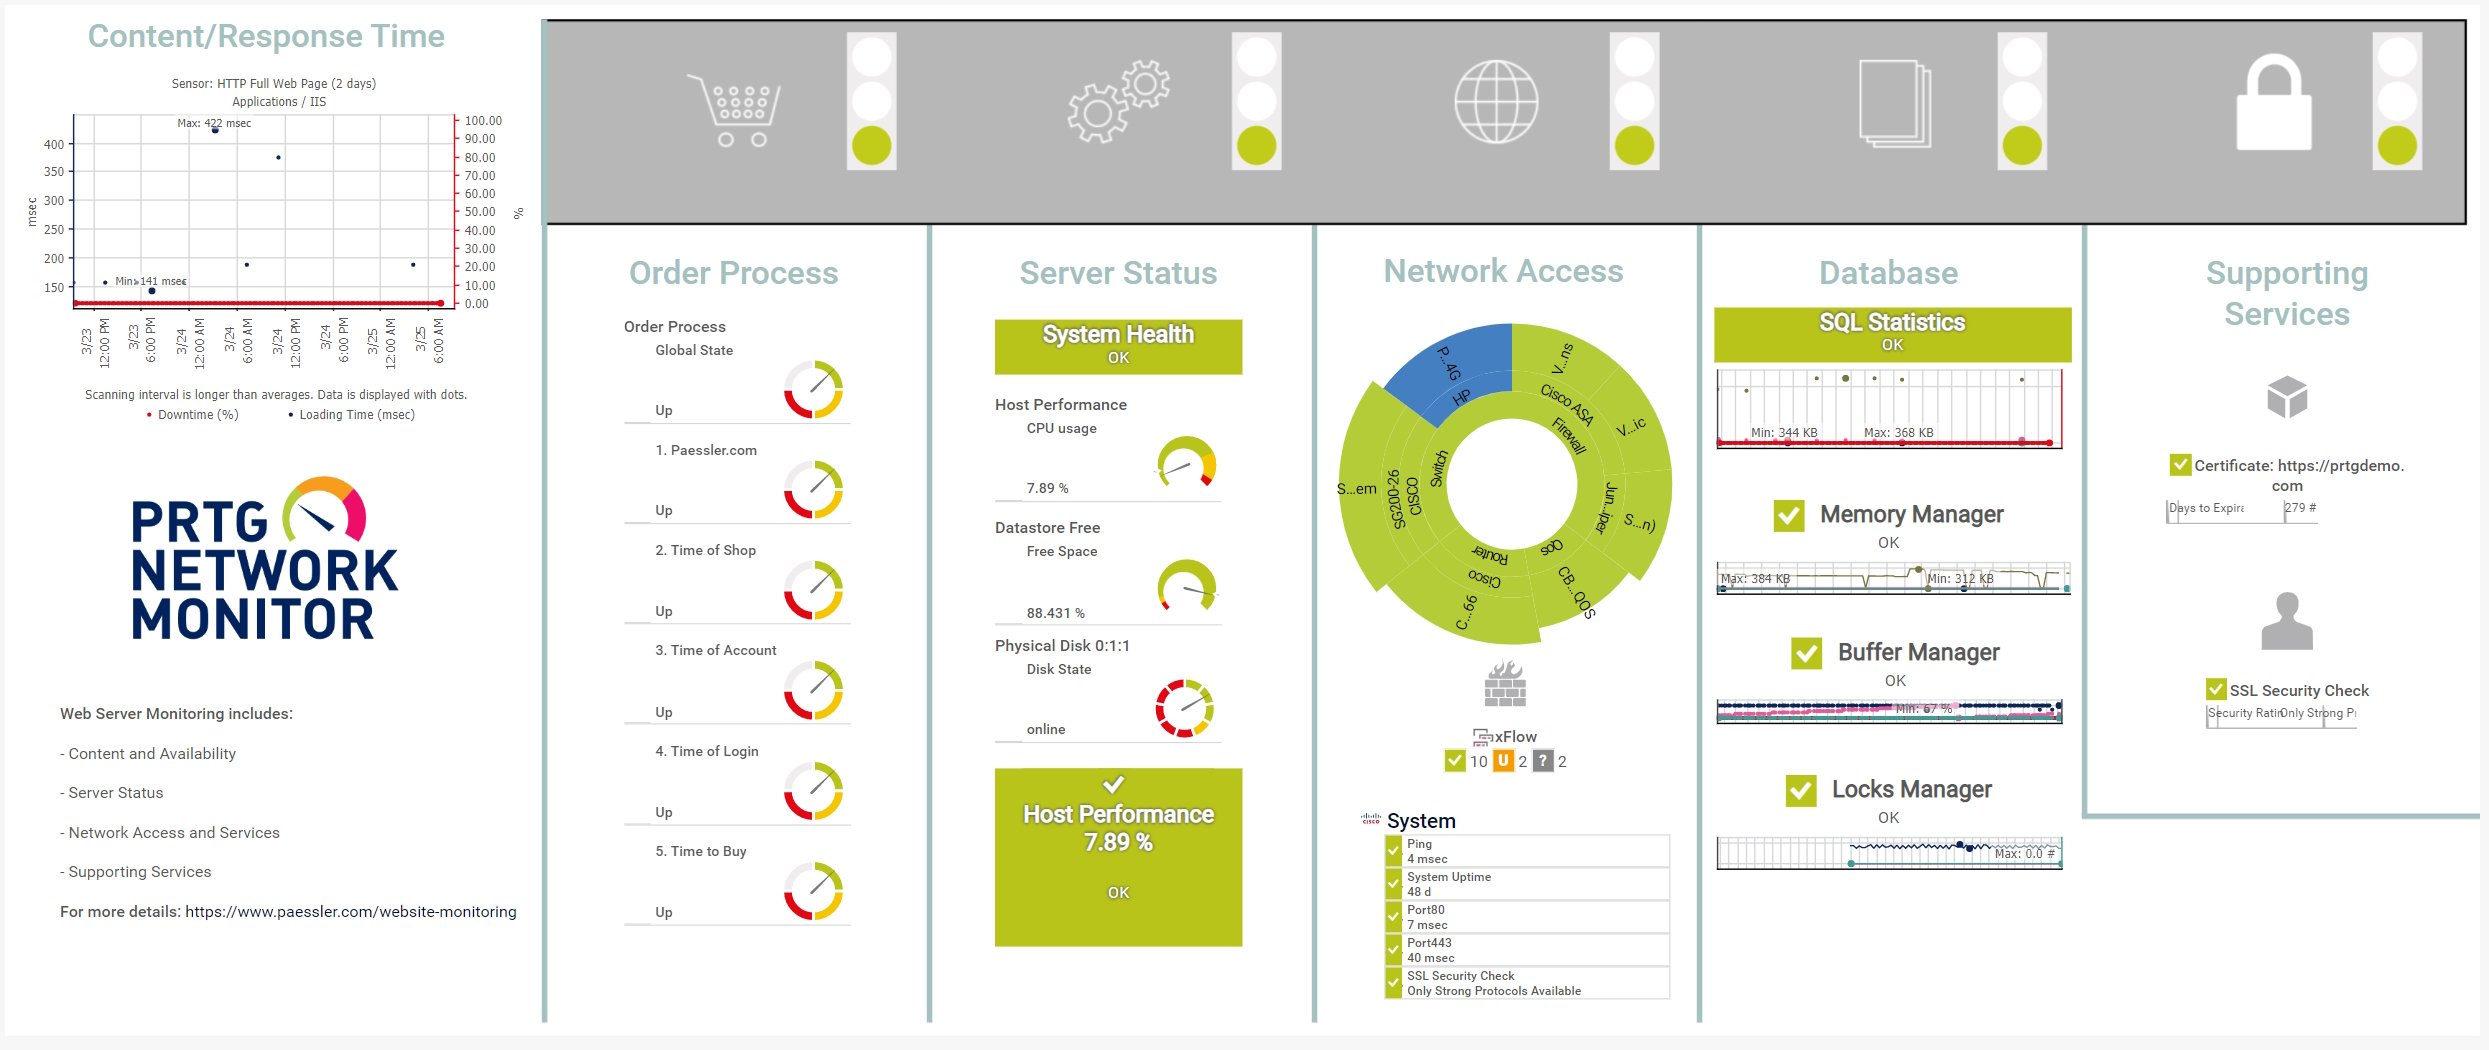
Custom PRTG dashboard for keeping an eye on the entire IT infrastructure
Live traffic data graph in PRTG
PRTG map for website monitoring
“All-around winning
network monitor”
“The real beauty of PRTG is the endless possibilities it offers”
“PRTG Network Monitor
is very hard to beat”
Think again. PRTG's all-in-one testing and performance monitoring solution simplifies optimization and maintains speed, stability, and reliability by default.
PRTG can carry out both active website load tests and passive website performance monitoring. This means you can:
With 250 + preconfigured sensors, plus the ability to create your own, you can gather the key metrics of every hardware or software component imaginable:
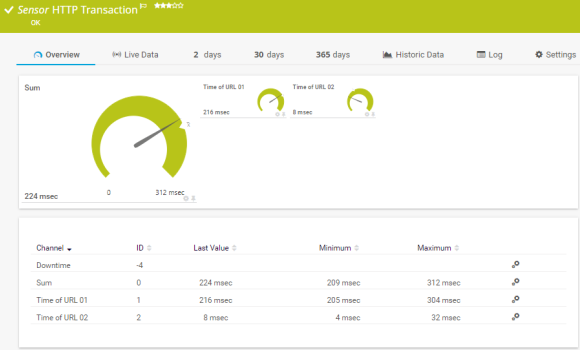
User journeys: the HTTP Transaction sensor checks for errors on your login screen, shopping cart, confirmation page, and other critical end-user touchpoints
PRTG comes with more than 250 native sensor types for monitoring your entire on-premises, cloud, and hybrid cloud environment out of the box. Check out some examples below!
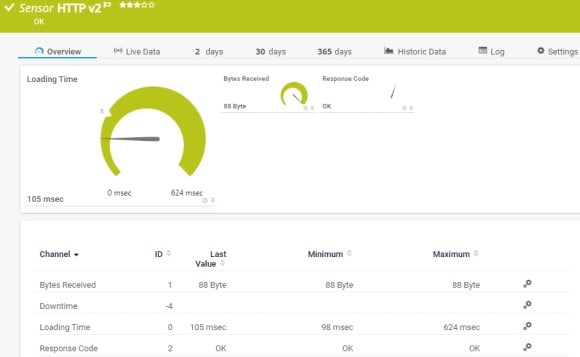
The HTTP v2 sensor monitors a web server. It can show the following:
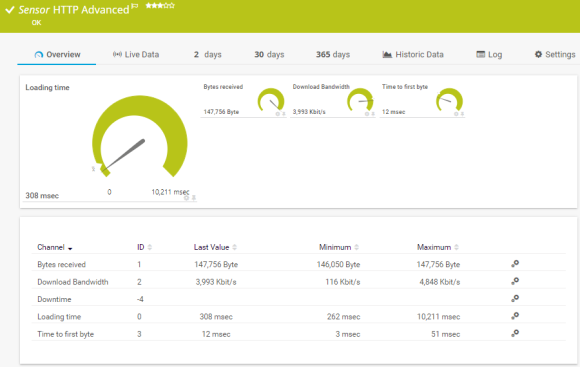
The HTTP Advanced sensor monitors the source code of a web page using HTTP. It supports authentication, content checks, and other advanced parameters. It can show the following:
The HTTP Full Web Page sensor monitors the full download time of a web page including assets such as images. In the background, it opens the web page in a browser instance to perform the measurement. It can show the following:
The HTTP Transaction sensor monitors an interactive website, such as a web shop, by performing a transaction using a set of HTTP URLs. The sensor monitors whether logins or shopping carts work properly. It can show the following:
See the PRTG Manual for a list of all available sensor types.

Custom alerts and data visualizations make it easy to monitor, identify, and prevent bottlenecks, server overload, latency, connectivity and capacity problems, and other website performance issues.
PRTG is set up in a matter of minutes and can be used on a wide variety of mobile devices.


“Excellent tool for detailed monitoring. Alarms and notifications work greatly. Equipment addition is straight forward and server initial setup is very easy. ...feel safe to purchase it if you intend to monitor a large networking landscape.”
Partnering with innovative IT vendors, Paessler unleashes synergies to create
new and additional benefits for joined customers.
IT that works constitutes a business-critical basis for a company's success. Availability and security must be defined for the respective purpose and closely monitored – by OT and IT alike.
Integrating monitoring results from PRTG into NetBrain maps makes the foundation for network automation.

With ScriptRunner Paessler integrates a powerful event automation platform into PRTG Network Monitor.
Real-time alerts and custom notifications make it easy to solve issues such as bottlenecks, server overload, latency, connectivity and capacity problems, and other website performance issues.
Network Monitoring Software – Version 24.4.102.1351 (November 12th, 2024)
Download for Windows and cloud-based version PRTG Hosted Monitor available
English, German, Spanish, French, Portuguese, Dutch, Russian, Japanese, and Simplified Chinese
Network devices, bandwidth, servers, applications, virtual environments, remote systems, IoT, and more
Choose the PRTG Network Monitor subscription that's best for you


PRTG is a proprietary software tool that tracks the health and performance of every component that could impact your website's stability and performance. Available for Windows-based on-premises servers or as a cloud-hosted solution, it's capable of monitoring unlimited local, remote, and virtual network devices, bringing critical system data together in one simple, intuitive interface you can access from anywhere: at the office, at home, or on the go.
PRTG is a standalone tool that can carry out two types of performance testing: load testing and stress testing. Load testing allows you to check that your website can handle expected user loads, while stress testing finds your website's breaking point: the test results show you the point at which your website's performance will start to suffer.
Read the following case studies to get a better idea of PRTG's capabilities:
Download the Webserver Stress Tool. Pick your parameters. Run the test. It's really that easy.
The tool will simulate traffic to test web performance and user experience. In other words, virtual users will simultaneously send HTTP requests to a webpage or web server, allowing you to work out whether it's as fast and stable as you’d expect it, and at which point its performance begins to drop.
You can run test scenarios with the following maximum thresholds:
Just be aware that our Webserver stress and load testing tool can't stress-test SSL-encrypted pages.
In PRTG, “sensors” are the basic monitoring elements. One sensor usually monitors one measured value in your network, for example the traffic of a switch port, the CPU load of a server, or the free space on a disk drive. On average, you need about 5-10 sensors per device or one sensor per switch port.
Paessler conducted trials in over 600 IT departments worldwide to tune its network monitoring software closer to the needs of sysadmins. The result of the survey: over 95% of the participants would recommend PRTG – or already have.

Paessler PRTG is used by companies of all sizes. Sysadmins love PRTG because it makes their job a whole lot easier.
Bandwidth, servers, virtual environments, websites, VoIP services – PRTG keeps an eye on your entire network.
Everyone has different monitoring needs. That’s why we let you try PRTG for free.