Custom alerts and data visualization let you quickly identify and prevent storage performance bottlenecks.
Although most data storage devices have their own built-in monitoring system, they are limited to the devices’ functionality and don’t see the full picture. Paessler PRTG’s comprehensive, all-in-one network monitoring software is therefore critical to map your storage system as well as your entire IT infrastructure in a central overview.
PRTG helps you avoid negative business impact due to storage problems and even downtime of the complete system by monitoring all storage components 24/7.
This means monitoring hardware and application health and availability – and, sometimes even more important, performance.
With PRTG, you can monitor hardware storage devices of the most popular manufacturers out of the box, for example Dell EMC, NetApp, HPE, IBM, Lenovo, Synology, QNAP, and Buffalo.
You run your storage infrastructure in the cloud? No problem. PRTG’s preconfigured sensors also include cloud service providers like AWS, Microsoft Azure, Google Drive, or Dropbox.
Use PRTG to keep an eye on the performance of almost every hardware and software component in classic IT environments you can think of.
Switches, CPUs, servers, databases, backup software, virtual hosts – with our monitoring software, you can rest assured that your entire network is taken care of.
Make sure your storage infrastructure monitoring is always targeted and aligned with the specific requirements of your network.
Set performance thresholds and let PRTG notify you via email, SMS, push notification, or other methods as soon as they’re breached.
Diagnose network issues by continuously tracking the performance of storage devices, storage arrays, storage pools, and other storage resources. Show response time, read/write speed, latency, throughput, CPU and memory usage, and other key metrics in real time. Visualize monitoring data in clear graphs and dashboards to identify problems more easily. Gain the overview you need to troubleshoot slowdowns and even outages in your storage environment.

Live traffic data graph in PRTG
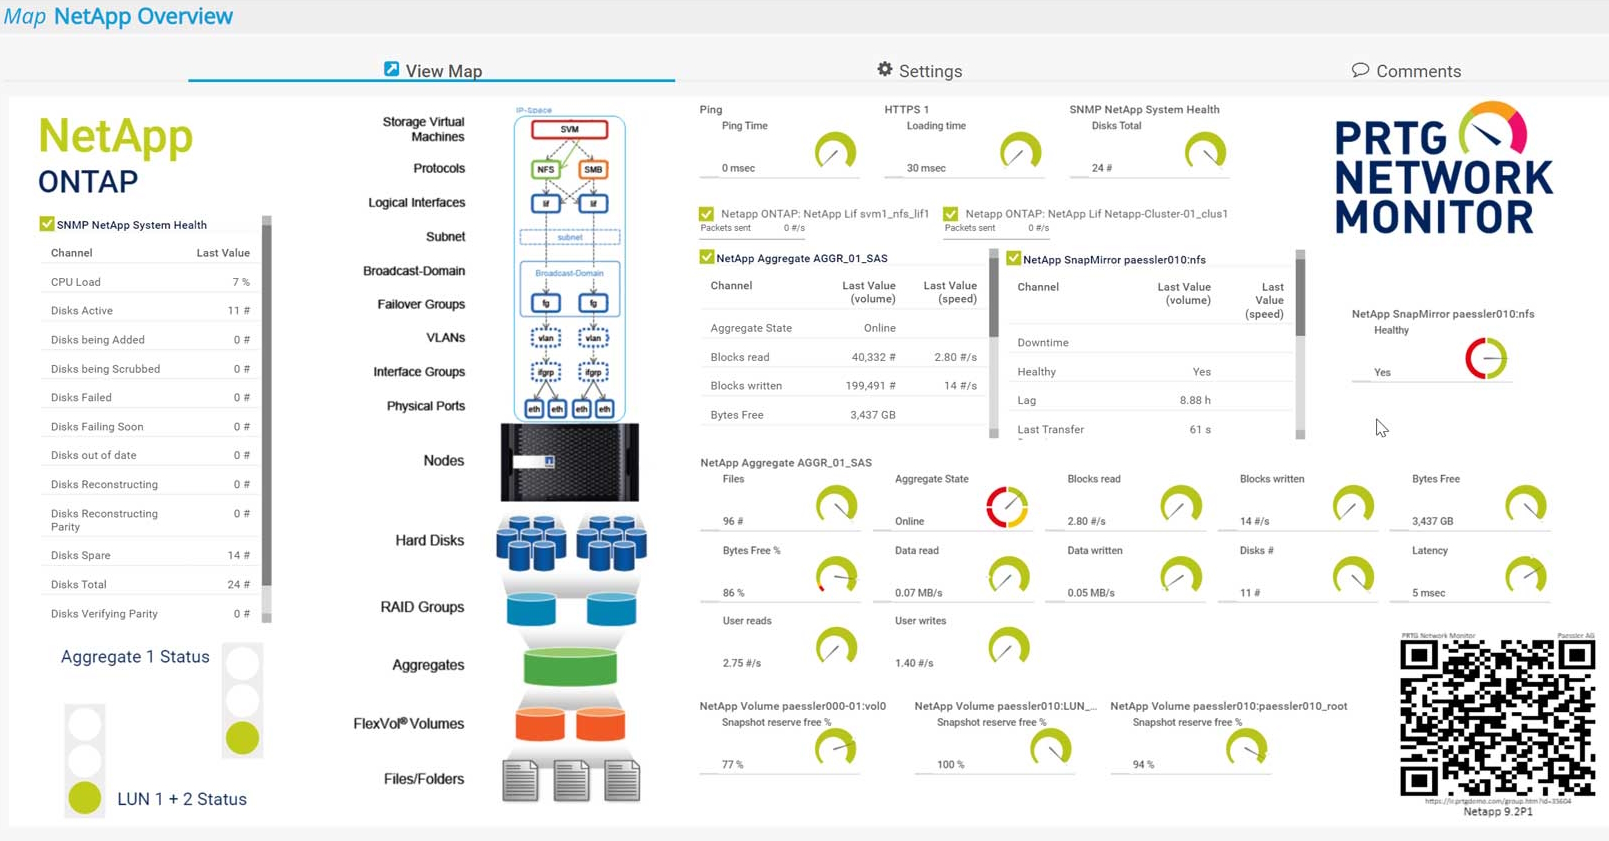
NetApp dashboard in PRTG

Device tree view of the complete monitoring setup

Custom PRTG dashboard for keeping an eye on the entire IT infrastructure
Live traffic data graph in PRTG
NetApp dashboard in PRTG
“All-around winning
network monitor”
“The real beauty of PRTG is the endless possibilities it offers”
“PRTG Network Monitor
is very hard to beat”
Track the performance of all your storage components from one place: read/write speed, data traffic, bandwidth usage, CPU load, memory usage, storage capacity, and much more. PRTG monitors everything round the clock, showing you detailed stats in intuitive, user-friendly dashboards.
Nip potentially serious storage issues such as bottlenecks or low storage space in the bud. Pick your preferred warning and error thresholds, and PRTG will email, text, or send an in-app notification when you're at risk of going under or over, so you can fix them promptly and avoid disruption (and colleagues' complaints).
Your CEO has big growth plans. But can your storage infrastructure support them? PRTG puts key performance data – live data or historical data of up to 365 days – at your fingertips, so you can spot where you're under- or over-resourced, and make better-informed choices on what storage devices, systems, and services to invest.
Your network, your rules. Tailor PRTG's powerful and flexible storage monitoring software so it meets your exact needs. Choose which storage components and parameters to track, and how PRTG presents the data. In fact, why not use our built-in, drag-and-drop map editor to design your own individual dashboard?
PRTG comes with more than 250 native sensor types for monitoring your entire on-premises, cloud, and hybrid cloud environment out of the box. Check out some examples below!
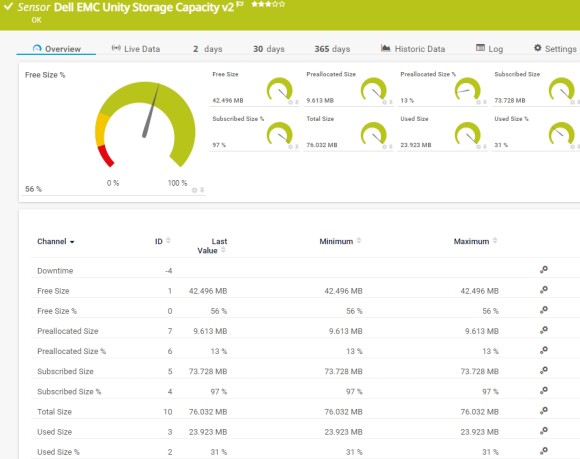
The Dell EMC Unity Storage Capacity v2 sensor monitors the storage capacity of a Dell EMC Unity storage system. It can show the following:
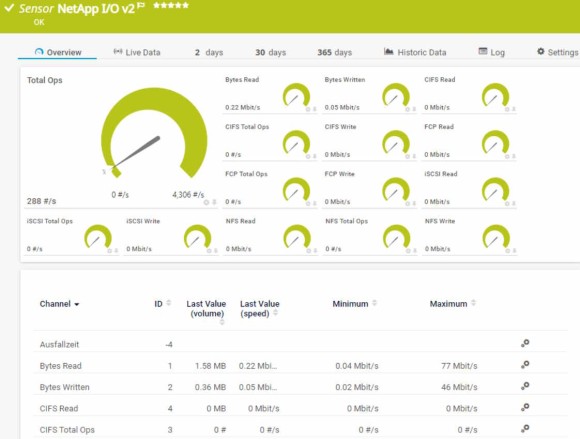
The NetApp I/O v2 sensor monitors input and output operations of a NetApp storage system using ONTAP. It can show the following:
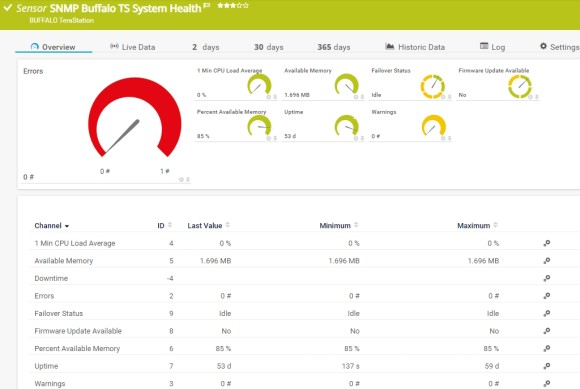
The SNMP Buffalo TS System Health sensor monitors the system health of a Buffalo TeraStation network-attached storage (NAS). It can show the following:
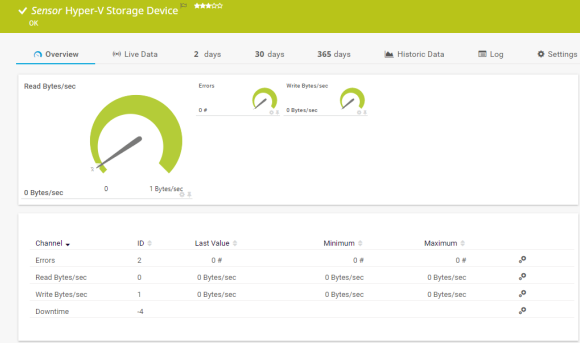
The Hyper-V Virtual Storage Device sensor monitors a virtual storage device that runs on a Microsoft Hyper-V host server via WMI or Windows performance counters. It can show the following:
See the PRTG Manual for a list of all available sensor types.

Real-time notifications mean faster troubleshooting so that you can act before more serious issues occur.
PRTG is set up in a matter of minutes and can be used on a wide variety of mobile devices.

For NetApp, Paessler has proven to be one of the qualified, best-of-breed infrastructure and application providers whose products have been tested to expertly integrate with NetApp storage systems.
What does this mean for you?
Partnering with innovative IT vendors, Paessler unleashes synergies to create
new and additional benefits for joined customers.
IT that works constitutes a business-critical basis for a company's success. Availability and security must be defined for the respective purpose and closely monitored – by OT and IT alike.
Integrating monitoring results from PRTG into NetBrain maps makes the foundation for network automation.

With ScriptRunner Paessler integrates a powerful event automation platform into PRTG Network Monitor.
Custom alerts and data visualization let you quickly identify and prevent storage performance bottlenecks.
Network Monitoring Software – Version 24.4.102.1351 (November 12th, 2024)
Download for Windows and cloud-based version PRTG Hosted Monitor available
English, German, Spanish, French, Portuguese, Dutch, Russian, Japanese, and Simplified Chinese
Network devices, bandwidth, servers, applications, virtual environments, remote systems, IoT, and more
Choose the PRTG Network Monitor subscription that's best for you


Storage performance is a critical indicator of how well storage devices are performing. Storage performance metrics help you assess the effectiveness of your storage system and its ability to support your business organization. Storage performance has become a kind of bottleneck in data processing, which is why storage devices often have to meet various metrics.
There are several organizations that help standardize storage performance metrics, including the Microsoft Exchange Solution Reviewed Program (ESRP) and the Storage Performance Council (SPC). The former is primarily a Microsoft Exchange Server program designed to simplify third-party storage testing and release solutions for Exchange Server. The latter is likewise an American organization that has taken up the cause of optimizing the performance of storage systems. To this end, SPC initiates and carries out benchmark tests. The organization also wants to support and implement storage standards. Listed below are some of the most common storage performance metrics:
Storage performance monitoring (SPM) refers to the process of measuring, analyzing, and managing the performance of data storage systems. It ensures that the storage infrastructure (including hard drives, SSDs, RAID systems, SANs, and NAS) operates efficiently, meeting the performance and availability requirements of applications and users. By monitoring various metrics and behaviors of storage systems, SPM helps identify performance bottlenecks, optimize data access speeds, and maintain reliability.
Key components of SPM include:
Storage systems have always been of vital importance for processes in companies and are therefore a core element of any IT concept. Failures can not only have fatal consequences for business success but even small performance losses can cause serious consequential problems in IT. This is true for a network-attached storage (NAS) in a small business as well as for a huge Storage Area Network (SAN) in an enterprise environment.
The rapid, often consumer-driven advances in computer technology have focused mostly on computing power rather than on the aspect of storage. CPU and GPU have grown, while system storage such as the hard disk drive has made only moderate progress and changed less significantly. Even if processor technology is reaching its physical limits, its capacity has improved a lot whereas the performance of the hard disk often cannot keep up with the performance of the processor.
PRTG helps prevent storage system failures, which can have fatal consequences for business success. In fact, even small performance losses can cause serious consequential problems in IT. This is true for a NAS in a small business as well as for a huge SAN in an enterprise environment. PRTG helps you prevent storage issues and ensure your storage system is optimized for peak performance.
In PRTG, “sensors” are the basic monitoring elements. One sensor usually monitors one measured value in your network, for example the traffic of a switch port, the CPU load of a server, or the free space on a disk drive. On average, you need about 5-10 sensors per device or one sensor per switch port.
Paessler conducted trials in over 600 IT departments worldwide to tune its network monitoring software closer to the needs of sysadmins. The result of the survey: over 95% of the participants would recommend PRTG – or already have.

Paessler PRTG is used by companies of all sizes. Sysadmins love PRTG because it makes their job a whole lot easier.
Bandwidth, servers, virtual environments, websites, VoIP services – PRTG keeps an eye on your entire network.
Everyone has different monitoring needs. That’s why we let you try PRTG for free.