![]()
REST API monitoring with PRTG
Keep a 24/7 eye on the availability and performance of your RESTful API integrations
- Automatically reads the content of XML and JSON files and creates suitable channels
- Individual REST configuration templates and custom XML and JSON mapping
- Sends real-time alerts if there’s a problem with REST API connectivity or performance
Our users give top ratings for monitoring with Paessler PRTG


PRTG REST API monitoring: What you’ll find on this page

PRTG makes REAT API monitoring as easy as it gets
Custom alerts and data visualization let you quickly identify and prevent issues with the availability and performance of RESTful API connections.
How REST API monitoring with PRTG works
Comprehensive REST monitoring
PRTG’s REST API monitoring includes the following key API metrics:
- Monitors REST API availability and other performance metrics
- Recognizes the content of XML and JSON files automatically
- Analyzes up to 50 parameters per sensor
- Automatically creates suitable channels for values
- Reads individual REST configuration templates
- Offers custom JSON and XML mapping
Quick and easy sensor setup
PRTG comes with preconfigured REST Custom sensors that you can add with a few clicks:
- Create an endpoint that you want to monitor in PRTG’s device tree.
- Add the REST Custom or the REST Custom v2 sensor
- Let PRTG automatically search for values to monitor or select a custom REST configuration template.
- Set custom warning and error thresholds.
- View sensor values at a glance using custom dashboards and maps.
What REST API monitoring looks like in PRTG
Diagnose network issues by continuously tracking the availability and performance of REST API integrations. Show API response times, latency, response codes, error rates, uptime, API call validation, and other key metrics in real time. Visualize monitoring data in clear graphs and dashboards to identify problems more easily. Gain the overview you need to troubleshoot outages, bottlenecks, authentication problems, and other API performance issues to optimize your network.

Device tree view of the complete monitoring setup
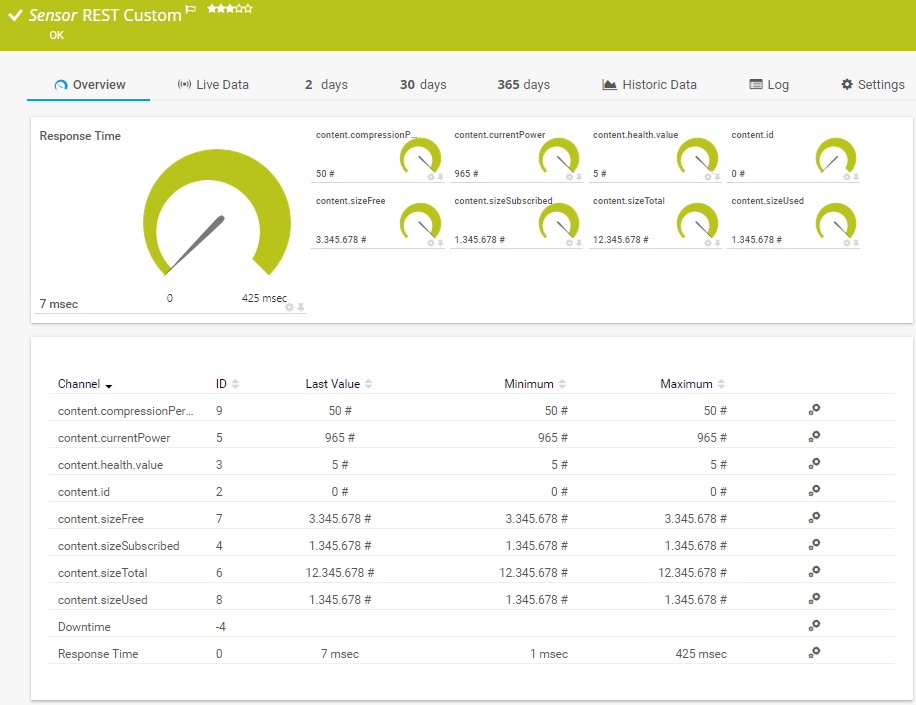
Preconfigured REST Custom sensor in PRTG

Custom PRTG dashboard for keeping an eye on the entire IT infrastructure
Start monitoring REST APIs with PRTG and see how it can make your network more reliable and your job easier.
IT experts agree: Paessler PRTG is a great solution for IT infrastructure monitoring

“All-around winning
network monitor”

“The real beauty of PRTG is the endless possibilities it offers”

“PRTG Network Monitor
is very hard to beat”
4 reasons to choose PRTG as your REST API monitoring tool
Connect your web services and cloud applications, the Internet of Things, and other endpoints via REST API to PRTG and track all the values you need to ensure a reliable and stable IT infrastructure.
Easy installation and setup
Install PRTG with a few clicks, enter an IP address range, and let the automatic network discovery do the first setup for you. You can then tailor your monitoring to suit and add the REST sensors you need, which will automatically read content from the XML and JSON files you provide.
24/7 comprehensive overview
Desktop, smartphone, or tablet – with PRTG, you can view everything at a glance. Check your REST values directly in the respective sensor, or create custom dashboards and maps that display data the way you want to. Our traffic light color coding immediately informs you if something’s amiss.
Customizable notifications
Define custom warning and error thresholds and PRTG will alert you via email, SMS, push notification, and more as soon as there’s unplanned downtime or any other network issue. You can even let PRTG take automatic action, for example, restarting a service or web application.
All-in-one network monitoring
PRTG is a comprehensive tool for monitoring your entire network. You get a centralized software that monitors all your hardware, applications, network traffic, and much more. Say goodbye to stand-alone solutions which are cumbersome, prone to error, and often cost way more.
Your REST API monitor at a glance – even on the go
Set up PRTG in minutes and use it on almost any mobile device.


Explore our preconfigured PRTG sensors for REST API monitoring
PRTG comes with more than 250 native sensor types for monitoring your entire on-premises, cloud, and hybrid cloud environment out of the box. Check out some examples below!
Find the root cause of the problem with our PRTG REST API monitoring solution
Real-time notifications mean faster troubleshooting so that you can act before more serious issues occur.
PRTG is compatible with all major vendors, products, and systems
![]()
Create innovative solutions with Paessler’s partners
Partnering with innovative vendors, Paessler unleashes synergies to create
new and additional benefits for joined customers.


ScriptRunner
With ScriptRunner, Paessler integrates a powerful event automation platform into PRTG Network Monitor.
“Excellent tool for detailed monitoring. Alarms and notifications work greatly. Equipment addition is straight forward and server initial setup is very easy. ...feel safe to purchase it if you intend to monitor a large networking landscape.”
Infrastructure and Operations Engineer in the Communications Industry, firm size 10B - 30B USD
PRTG makes REAT API monitoring as easy as it gets
Custom alerts and data visualization let you quickly identify and prevent issues with the availability and performance of RESTful API connections.

PRTG: The multi-tool for sysadmins
Adapt PRTG individually and dynamically to your needs and rely on a strong API:- HTTP API: Access monitoring data and manipulate monitoring objects via HTTP requests
- Custom sensors: Create your own PRTG sensors for customized monitoring
- Custom notifications: Create your own notifications and send action triggers to external systems
- REST Custom sensor: Monitor almost everything that provides data in XML or JSON format
We asked: would you recommend PRTG?
Over 95% of our customers say yes!
Paessler conducted trials in over 600 IT departments worldwide to tune its network monitoring software closer to the needs of sysadmins.
The result of the survey: over 95% of the participants would recommend PRTG – or already have.

Still not convinced?
![]()
More than 500,000
sysadmins love PRTG
Paessler PRTG is used by companies of all sizes. Sysadmins love PRTG because it makes their job a whole lot easier.
![]()
Monitor your entire IT infrastructure
Bandwidth, servers, virtual environments, websites, VoIP services – PRTG keeps an eye on your entire network.
![]()
Try Paessler PRTG
for free
Everyone has different monitoring needs. That’s why we let you try PRTG for free.
![]()
Start monitoring REST APIs with PRTG and see how it can make your network more reliable and your job easier.
|
PRTG |
Network Monitoring Software - Version 25.1.102.1373 (January 9th, 2025) |
|
Hosting |
Download for Windows and cloud-based version PRTG Hosted Monitor available |
Languages |
English, German, Spanish, French, Portuguese, Dutch, Russian, Japanese, and Simplified Chinese |
Pricing |
Up to 100 sensors for free (Price List) |
Unified Monitoring |
Network devices, bandwidth, servers, applications, virtual environments, remote systems, IoT, and more |
Supported Vendors & Applications |
|
Discover more monitoring insights and stories

Solutions for all your monitoring needs

Powerful stories from the monitoring world

Combining the broad monitoring feature set of PRTG with IP Fabric’s automated network assurance creates a new level of network visibility and reliability.