![]()
NTP monitoring with PRTG
Ensure your systems are always on time
- Monitor the availability and health of your NTP servers round the clock
- Check that time synchronization is working as it should
- Receive real-time alerts and identify root causes of errors more quickly
Our users give top ratings for monitoring with Paessler PRTG


PRTG NTP monitoring: What you’ll find on this page

PRTG makes NTP server monitoring as easy as it gets
Custom alerts and data visualization let you quickly identify and prevent time synchronization issues.
Make troubleshooting easier with PRTG as your NTP tool
Eliminate ambiguity in your network
Every minute counts when searching for the cause of a problem in your network. Paessler PRTG helps you know if any unusual incidents happened at the exact time the problem occurred.
This eliminates ambiguity regarding the classification of errors based on the exact time of their occurrence. You can also generate custom reports that give you more in-depth insights into the collected NTP data for future optimization.
Pinpoint sources of errors faster
Accurate time synchronization is essential for consistency across devices in your network. Many systems, including databases, file systems, and distributed applications, rely on precise timestamps.
Inaccurate time can lead to errors, data corruption, or inconsistencies. PRTG helps you spend less time racking your brain and comparing log files. Its easy-to-read dashboard gives you a 24/7 overview so you can identify the sources of errors and troubleshoot faster.
Avoid time differences between distributed systems
In distributed systems, particularly those spread across different geographical locations, accurate time synchronization is critical. PRTG ensures that time synchronization is up and running with the precise timestamp sent by an NTP server.
This way, you can avoid differences between local system times and the NTP server timestamp and prevent issues that could arise from time differences.
What NTP time server monitoring looks like in PRTG
Diagnose network issues by continuously tracking the availability, health, and performance of your NTP server. Show response times, time offset, NTP status, CPU load, and other key metrics in real time. Visualize monitoring data in clear graphs and dashboards to identify problems more easily. Gain the overview you need to troubleshoot NTP service and server hardware issues.

Device tree view of the complete monitoring setup
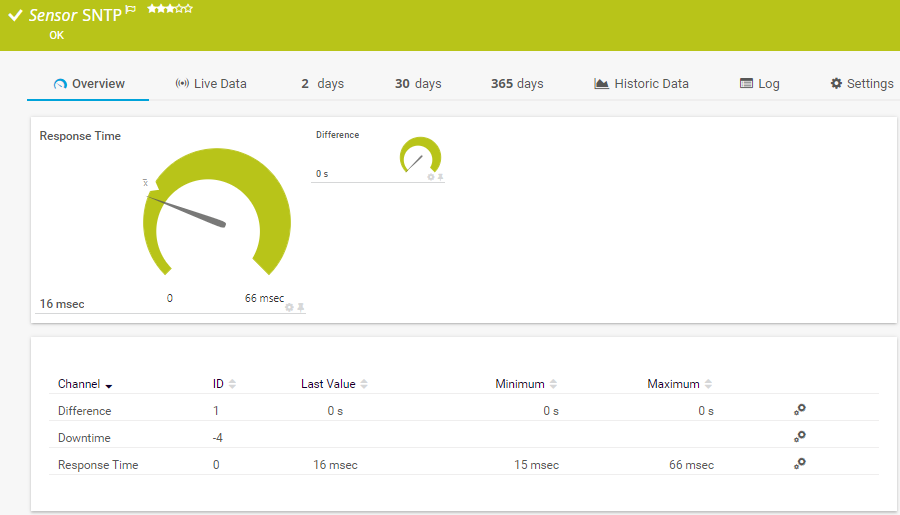
Preconfigured SNTP sensor in PRTG

Custom PRTG dashboard for keeping an eye on the entire IT infrastructure
Start monitoring NTP service management with PRTG and see how it can make your network more reliable and your job easier.
IT experts agree: Paessler PRTG is a great solution for IT infrastructure monitoring

“All-around winning
network monitor”

“The real beauty of PRTG is the endless possibilities it offers”

“PRTG Network Monitor
is very hard to beat”
How NTP monitoring with PRTG works
A high-precision reference clock, such as a GPS satellite, is the basis of an NTP server’s timestamp.
PRTG’s preconfigured SNTP sensor continuously monitors the response time of an NTP server. It also compares the local system times of your network devices with the NTP server’s precise timestamp.
It can show the following metrics:
- Response time of the NTP server
- Local system time and precise NTP server time
- Time difference compared to the local system time
Your NTP monitor at a glance – even on the go
Set up PRTG in minutes and use it on almost any mobile device.


Find the root cause of the problem with our PRTG NTP monitoring solution
Real-time notifications mean faster troubleshooting so that you can act before more serious issues occur.
PRTG is compatible with all major vendors, products, and systems
![]()
Create innovative solutions with Paessler’s partners
Partnering with innovative vendors, Paessler unleashes synergies to create
new and additional benefits for joined customers.


UVnetworks
UVexplorer integrates tightly with PRTG to bring fast and accurate network discovery, detailed device inventory, and automatic network mapping to the PRTG platform.
“Excellent tool for detailed monitoring. Alarms and notifications work greatly. Equipment addition is straight forward and server initial setup is very easy. ...feel safe to purchase it if you intend to monitor a large networking landscape.”
Infrastructure and Operations Engineer in the Communications Industry, firm size 10B - 30B USD
PRTG makes NTP server monitoring as easy as it gets
Custom alerts and data visualization let you quickly identify and prevent time synchronization issues.

PRTG: The multi-tool for sysadmins
Adapt PRTG individually and dynamically to your needs and rely on a strong API:- HTTP API: Access monitoring data and manipulate monitoring objects via HTTP requests
- Custom sensors: Create your own PRTG sensors for customized monitoring
- Custom notifications: Create your own notifications and send action triggers to external systems
- REST Custom sensor: Monitor almost everything that provides data in XML or JSON format
We asked: would you recommend PRTG?
Over 95% of our customers say yes!
Paessler conducted trials in over 600 IT departments worldwide to tune its network monitoring software closer to the needs of sysadmins.
The result of the survey: over 95% of the participants would recommend PRTG – or already have.

Still not convinced?
![]()
More than 500,000
sysadmins love PRTG
Paessler PRTG is used by companies of all sizes. Sysadmins love PRTG because it makes their job a whole lot easier.
![]()
Monitor your entire IT infrastructure
Bandwidth, servers, virtual environments, websites, VoIP services – PRTG keeps an eye on your entire network.
![]()
Try Paessler PRTG
for free
Everyone has different monitoring needs. That’s why we let you try PRTG for free.
![]()
Start monitoring NTP service management with PRTG and see how it can make your network more reliable and your job easier.
|
PRTG |
Network Monitoring Software - Version 25.1.104.1961 (April 7th, 2025) |
|
Hosting |
Download for Windows and cloud-based version PRTG Hosted Monitor available |
Languages |
English, German, Spanish, French, Portuguese, Dutch, Russian, Japanese, and Simplified Chinese |
Pricing |
Up to 100 sensors for free (Price List) |
Unified Monitoring |
Network devices, bandwidth, servers, applications, virtual environments, remote systems, IoT, and more |
Supported Vendors & Applications |
|
Discover more monitoring insights and stories


Powerful stories from the monitoring world

Combining the broad monitoring feature set of PRTG with IP Fabric’s automated network assurance creates a new level of network visibility and reliability.