Gli avvisi personalizzati e la visualizzazione dei dati consentono di identificare e prevenire rapidamente i problemi di traffico dati e di congestione della rete.
Diagnosticare i problemi di rete tracciando continuamente i dati del traffico di rete. Mostra le congestioni della rete, i colli di bottiglia della larghezza di banda e altre metriche chiave in tempo reale. Visualizzare i dati di monitoraggio in grafici e dashboard chiari per identificare più facilmente i problemi. Ottenete la Panoramica necessaria per risolvere i problemi di salute della rete, i tempi di inattività e tutti i tipi di problemi di prestazioni.

Grafico dei dati di traffico in tempo reale in PRTG

Albero dei dispositivi dell'intera configurazione di monitoraggio

Dashboard PRTG personalizzato per tenere sotto controllo l'intera infrastruttura IT
Grafico dei dati di traffico in tempo reale in PRTG
Albero dei dispositivi dell'intera configurazione di monitoraggio
“Monitor di rete vincente sotto tutti i punti di vista”
“La vera bellezza di PRTG sta nelle infinite possibilità che offre”
“PRTG Network Monitor
è molto difficile da superare”
PRTG consolida continuamente tutte le informazioni di monitoraggio in un dashboard personalizzabile e di facile lettura. Basta una rapida occhiata, ovunque e in qualsiasi momento, per sapere che tutto è a posto.
Grazie alla funzione Auto-discovery, che esegue il ping di un intervallo specifico di indirizzi IP nella subnet, è possibile configurare PRTG in pochi minuti e iniziare immediatamente a controllare il traffico di rete.
PRTG è dotato di oltre 250 tipi di sensori predefiniti e offre anche sensori personalizzabili in grado di monitorare le metriche più importanti per l'azienda.
PRTG vi avvisa tempestivamente se il traffico aumenta e rischia di causare problemi alla vostra rete. La sua funzionalità di allarme integrata agisce rapidamente e vi avvisa via SMS, testo, notifica push e altro ancora se vengono superate le soglie.
A differenza degli strumenti a riga di comando come Traceroute e Tracert, che vengono utilizzati in modo selettivo, PRTG monitora continuamente l'intera infrastruttura IT.
In caso di ritardi, interruzioni o crash, PRTG suona immediatamente l'allarme e vi notifica come preferite: via e-mail, SMS, notifica push e altro ancora.
Le ragioni per cui un pacchetto di dati non raggiunge la sua destinazione sono molteplici. Con PRTG, la risoluzione dei problemi è più rapida e semplice grazie al monitoraggio continuo e agli allarmi rapidi.
PRTG è dotato di oltre 250 tipi di sensori nativi per il monitoraggio dell'intero ambiente on-premises, cloud e cloud ibrido. Dai un'occhiata ad alcuni esempi qui sotto!
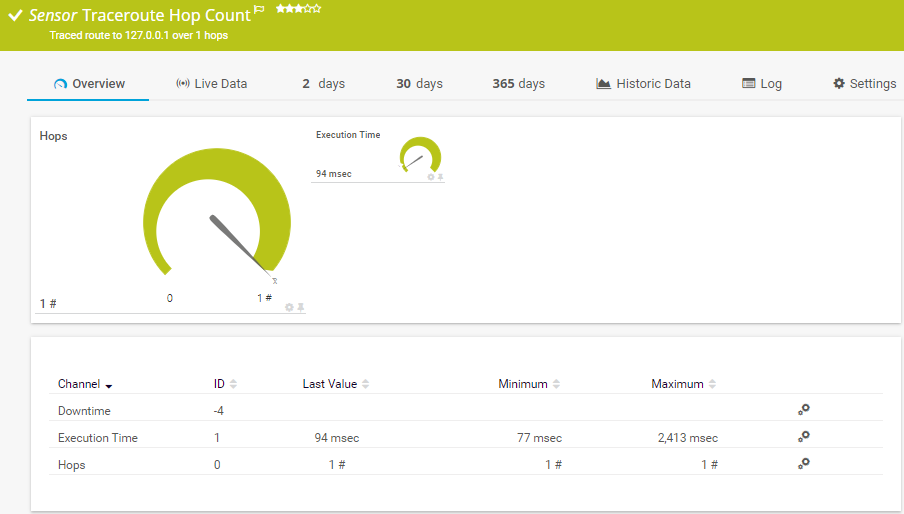
Il sensore Traceroute Hop Count traccia il numero di hop dal sistema della sonda all'indirizzo IP/nome DNS del dispositivo principale. Può mostrare quanto segue:
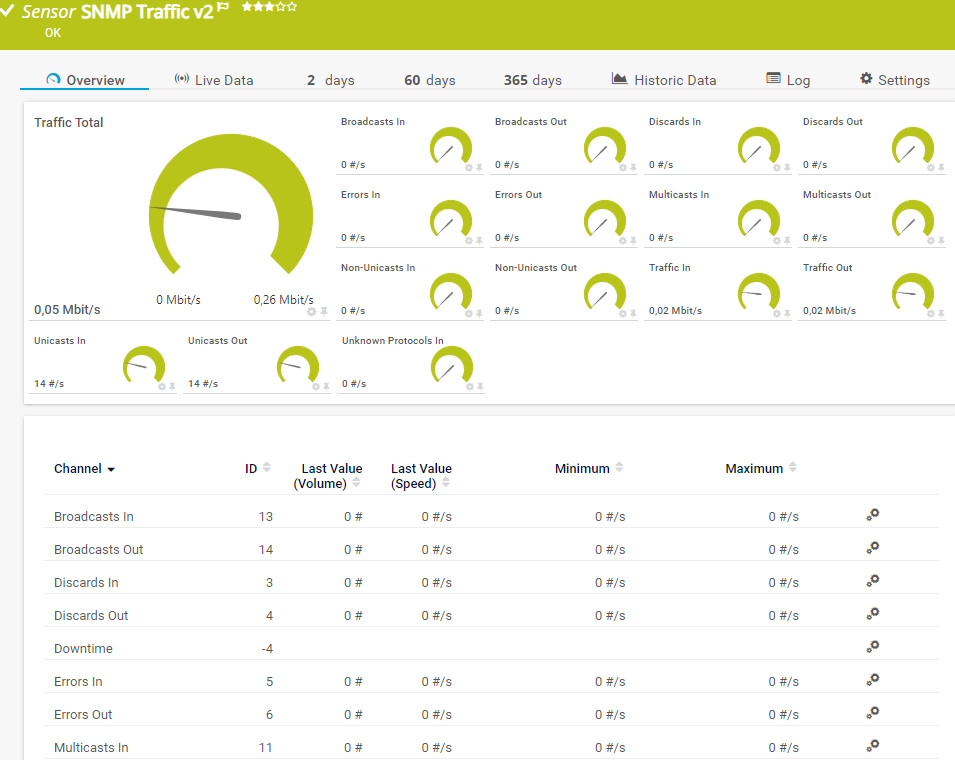
Il sensore SNMP Traffic v2 monitora la larghezza di banda e il traffico di un dispositivo. Può mostrare quanto segue:
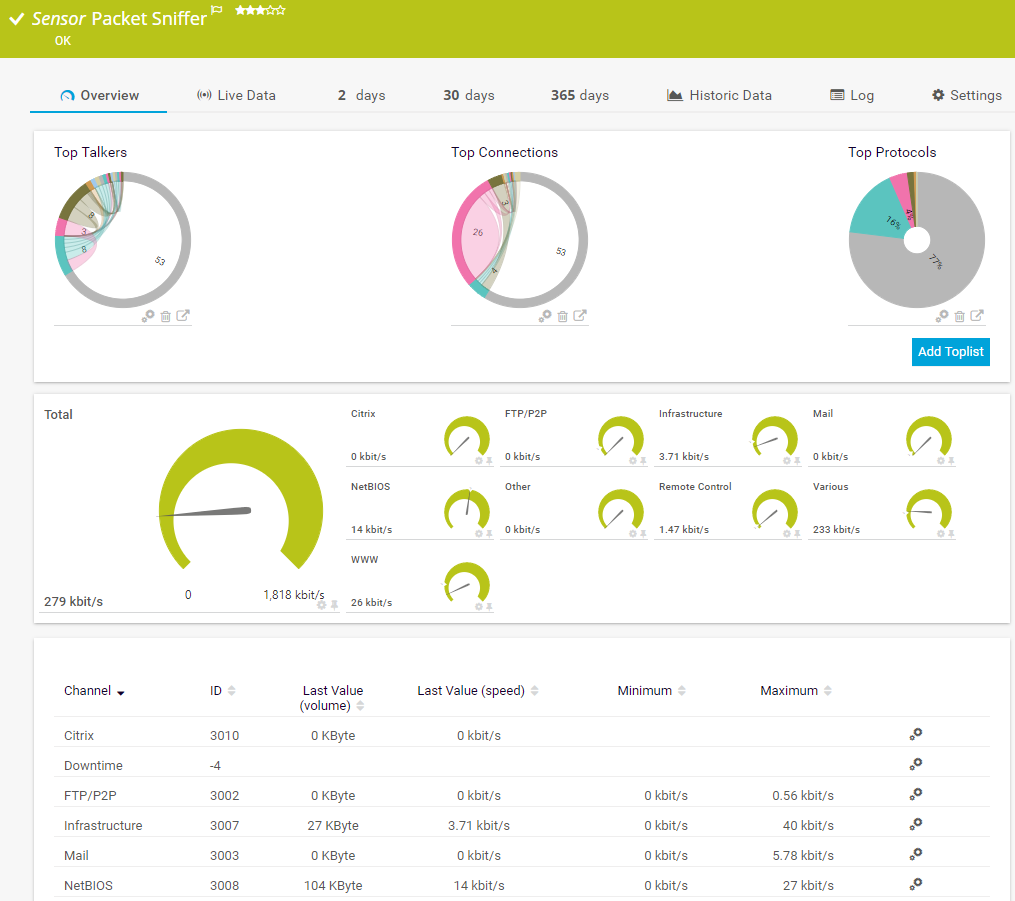
Il sensore Packet Sniffer monitora le intestazioni dei pacchetti di dati che passano attraverso una scheda di rete locale utilizzando un packet sniffer integrato. È possibile scegliere tra canali predefiniti. Può mostrare i seguenti elementi e altri ancora:
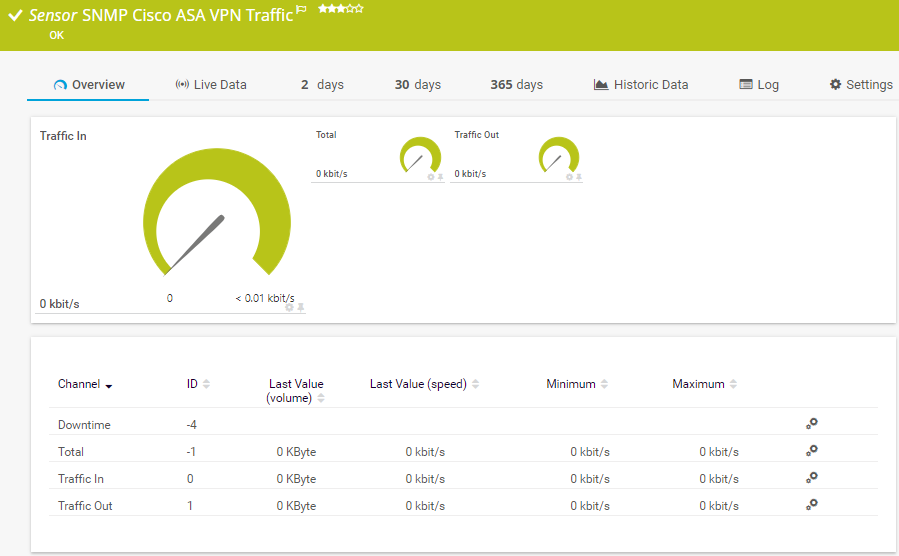
Il sensore SNMP Cisco ASA VPN Traffic monitora il traffico di una connessione VPN Internet Protocol Security (IPsec) su una Cisco Adaptive Security Appliance. Può mostrare quanto segue:
Consulta il manuale di PRTG per un elenco di tutti i tipi di sensore disponibili.
Notifiche in tempo reale significano una risoluzione più rapida dei problemi, in modo da poter intervenire prima che si verifichino problemi più gravi.

PRTG consente di eseguire un traceroute su uno specifico server o dispositivo di rete con soli 2 clic.
Nota: il dispositivo di destinazione deve essere incorporato nel monitoraggio.
PRTG eseguirà un traceroute sul dispositivo di destinazione e visualizzerà i risultati in pochi secondi.
Configurate PRTG in pochi minuti e utilizzatelo su quasi tutti i dispositivi mobili.


“Eccellente strumento per un monitoraggio dettagliato. Gli avvisi e le notifiche funzionano perfettamente. L'aggiunta dei dispositivi è intuitiva e la configurazione iniziale del server è molto semplice. ...acquistatelo tranquillamente se desiderate monitorare un vasto panorama di rete.”
Grazie alla collaborazione con fornitori IT innovativi, Paessler libera sinergie per creare nuovi e ulteriori vantaggi per i suoi clienti.

La combinazione dell'ampio set di funzioni di monitoraggio di PRTG con la garanzia di rete automatizzata di IP Fabric crea un nuovo livello di visibilità e affidabilità della rete.

Rhebo e PRTG offrono una soluzione di monitoraggio completa per gli ambienti IT e OT: dal monitoraggio delle condizioni fino al rilevamento di anomalie e minacce.

UVexplorer si integra perfettamente con PRTG per offrire una scoperta rapida e accurata della rete, un inventario dettagliato dei dispositivi e una mappatura automatica della rete alla piattaforma PRTG.
Gli avvisi personalizzati e la visualizzazione dei dati consentono di identificare e prevenire rapidamente i problemi di traffico dati e di congestione della rete.
Software di monitoraggio della rete – Versione 24.4.102.1351 (November 12th, 2024)
Disponibile il download della versione per Windows e della versione cloud-based PRTG Hosted Monitor
Inglese, tedesco, spagnolo, francese, portoghese, olandese, russo, giapponese e cinese semplificato
Dispositivi di rete, larghezza di banda, server, applicazioni, ambienti virtuali, sistemi remoti, IoT e molto altro
Scegli l'abbonamento a PRTG Network Monitor più adatto a te


Un tracciatore di traffico di rete, noto anche come analizzatore di traffico di rete o packet sniffer, è uno strumento utilizzato per catturare e analizzare i pacchetti di dati che scorrono attraverso una rete di computer. IT consente agli utenti di monitorare e ispezionare il traffico per vari scopi, tra cui la risoluzione di problemi di rete, il monitoraggio delle prestazioni della rete e il rilevamento di minacce alla sicurezza come tentativi di intrusione o malware.
Catturando e analizzando le intestazioni e i payload dei pacchetti, i tracciatori del traffico di rete forniscono informazioni sul comportamento della rete, aiutando gli amministratori a comprendere i modelli di traffico e a identificare le anomalie.
No. Paessler PRTG Network Monitor è un software di monitoraggio di rete proprietario in grado di tenere sotto controllo l'intera infrastruttura IT, tra cui:
Il monitoraggio del traffico di rete prevede l'osservazione e l'analisi in tempo reale dei pacchetti di dati che scorrono attraverso una rete. IT fornisce agli amministratori informazioni immediate sulle prestazioni, l'utilizzo e gli incidenti di sicurezza della rete. Gli strumenti di monitoraggio come il PRTG Network Monitor mostrano in genere l'attività di rete in tempo reale e possono includere caratteristiche di monitoraggio del traffico, avvisi e statistiche in tempo reale.
D'altra parte, la registrazione del traffico di rete comporta la cattura e la memorizzazione dei pacchetti di dati per un'analisi successiva. IT permette agli amministratori di rivedere l'attività di rete passata, indagare sugli incidenti di sicurezza e risolvere i problemi in modo retrospettivo. Il traffico registrato può essere analizzato con vari strumenti e tecniche, fornendo una visione dettagliata del comportamento della rete nel tempo.
Trace Route (o "Traceroute") è uno strumento a riga di comando di Linux/Unix che permette di tracciare il percorso dei dati nella rete. I singoli passaggi vengono catturati e registrati. Di conseguenza, è possibile identificare i colli di bottiglia e le interruzioni.
Uno strumento simile a riga di comando esiste anche per Windows. Questo strumento si chiama "Tracert" e consente di determinare il percorso dei pacchetti di dati immettendo comandi nella riga di comando. Ad esempio, Tracert consente di individuare il punto in cui un pacchetto di dati è stato ritardato.
In PRTG, i “sensori” sono gli elementi base del monitoraggio. Un sensore monitora solitamente un valore misurato nella tua rete (ad esempio, il traffico di una porta switch, il carico della CPU di un server o lo spazio libero di un’unità disco). In media, occorrono circa 5-10 sensori per ogni dispositivo o un sensore per ogni porta switch.
Paessler ha condotto prove in oltre 600 dipartimenti IT in tutto il mondo per mettere a punto il suo software di monitoraggio di rete più vicino alle esigenze dei sysadmin. Il risultato è che più del 95% degli intervistati consiglierebbe PRTG – o lo ha già fatto.

Paessler PRTG è utilizzato da aziende di tutte le dimensioni. Gli amministratori di sistema adorano PRTG perché rende il loro lavoro molto più semplice.
Ampiezza di banda, server, ambienti virtuali, siti Web, servizi VoIP - PRTG tiene d'occhio la tua intera rete.
Tutti hanno esigenze di monitoraggio diverse. Ecco perché ti lasciamo provare PRTG gratuitamente. Inizia oggi stesso la tua prova.