![]()
LDAP monitoring with PRTG
Increase the availability of your directory servers, applications, and services
- Continuously monitor your directory services using LDAP
- Quickly detect and resolve critical performance issues
- Set up in minutes with preconfigured or custom sensors
Our users give top ratings for monitoring with Paessler PRTG


PRTG makes LDAP monitoring as easy as it gets
Custom alerts and data visualization let you quickly identify and prevent low performance and downtimes of your directory servers and services.
Maintain the reliability & performance of your LDAP servers with PRTG
LDAP (Lightweight Directory Access Protocol) is typically used to authenticate user accounts and users, for example the employees of a company. With LDAP monitoring, however, the focus isn’t so much on the LDAP protocol but on the status of LDAP servers. With Paessler PRTG, you can keep an eye on all key parameters of your directory servers.
Availability monitoring
When response times are too high and uptime too low, access to data becomes painstakingly slow – or even nonexistent. This not only causes headaches for users, but also reduces the productivity of your business. Avoid downtime and network crashes by using LDAP monitoring with PRTG.
Performance monitoring
Set up PRTG to monitor CPU usage, memory, and disk usage on the LDAP server to ensure it has enough resources to handle requests efficiently. Make sure that your hardware performs at its best by quickly detecting and resolving critical performance issues to enhance user experience.
Security monitoring
Always have an eye on your log files for better access control over your LDAP directory, including failed login attempts. PRTG comes with a wealth of historical data that you can analyze in detail to identify unauthorized access attempts or unusual patterns of activity.
What LDAP server observability looks like in PRTG
Diagnose network issues by continuously tracking the availability, health, and performance of your LDAP server. Show detailed information about response times, CPU load, bandwidth usage, network traffic, and other key metrics in real time. Visualize monitoring data in clear graphs and dashboards to identify problems more easily. Gain the overview you need to troubleshoot slow authentication workflows, faulty LDAP configs, server downtimes, and other issues.

Device tree view of the complete monitoring setup
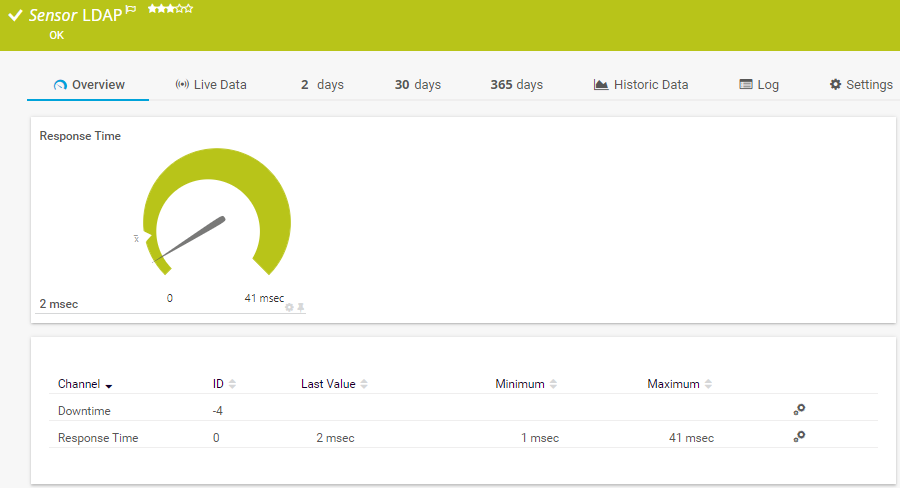
Preconfigured LDAP sensor in PRTG

Custom PRTG dashboard for keeping an eye on the entire IT infrastructure
Start monitoring LDAP servers with PRTG and see how it can make your network more reliable and your job easier.
IT experts agree: Paessler PRTG is a great solution for IT infrastructure monitoring

“All-around winning
network monitor”

“The real beauty of PRTG is the endless possibilities it offers”

“PRTG Network Monitor
is very hard to beat”
How monitoring via LDAP works
Out-of-the-box monitoring
PRTG comes equipped with an LDAP sensor that connects to the LDAP server (or directory) and measures the response time. This connection is called a “bind” operation, which means a login to the LDAP server using the “bind” command.
Proactive troubleshooting
If the server stops responding (or the response time exceeds a predefined threshold), PRTG immediately sends you an alert. This allows you to quickly fix the problem before your network crashes by allocating resources more efficiently, for example with advanced load balancing.
Your LDAP monitor at a glance – even on the go
Set up PRTG in minutes and use it on almost any mobile device.


Find the root cause of the problem with our PRTG LDAP monitoring solution
Real-time notifications mean faster troubleshooting so that you can act before more serious issues occur.
PRTG is compatible with all major vendors, products, and systems
![]()
3 simple reasons PRTG is the best LDAP monitoring solution
PRTG is a network monitoring tool that works great in distributed networks for the precise monitoring of mail servers, web servers, database servers, virtual servers, and LDAP servers.
PRTG monitors your entire IT infrastructure
PRTG monitors your network traffic, applications, bandwidth, cloud services, databases, virtual environments, availability & uptime, ports, IP addresses, hardware status, network security, web services, and much more.
PRTG supports all important technologies
Monitor your network with PRTG via SNMP, flow (NetFlow, jFlow, sFlow, IPFIX), SSH, WMI, SQL, or ping. PRTG also supports technologies used in industrial IT, such as OPC UA, MQTT, or Modbus. Use the powerful PRTG API for custom integrations (for example via Python, PowerShell, or REST).
PRTG can be used for any operating system
Download and install PRTG on a Windows system (or Linux with the new multi-platform probe), or use our cloud-based product for any operating system. Our native PRTG desktop application runs on Windows or macOS for even quicker access and multi-server views.
Create innovative solutions with Paessler’s partners
Partnering with innovative vendors, Paessler unleashes synergies to create
new and additional benefits for joined customers.


UVnetworks
UVexplorer integrates tightly with PRTG to bring fast and accurate network discovery, detailed device inventory, and automatic network mapping to the PRTG platform.
“Excellent tool for detailed monitoring. Alarms and notifications work greatly. Equipment addition is straight forward and server initial setup is very easy. ...feel safe to purchase it if you intend to monitor a large networking landscape.”
Infrastructure and Operations Engineer in the Communications Industry, firm size 10B - 30B USD
PRTG makes LDAP monitoring as easy as it gets
Custom alerts and data visualization let you quickly identify and prevent low performance and downtimes of your directory servers and services.

PRTG: The multi-tool for sysadmins
Adapt PRTG individually and dynamically to your needs and rely on a strong API:- HTTP API: Access monitoring data and manipulate monitoring objects via HTTP requests
- Custom sensors: Create your own PRTG sensors for customized monitoring
- Custom notifications: Create your own notifications and send action triggers to external systems
- REST Custom sensor: Monitor almost everything that provides data in XML or JSON format
We asked: would you recommend PRTG?
Over 95% of our customers say yes!
Paessler conducted trials in over 600 IT departments worldwide to tune its network monitoring software closer to the needs of sysadmins.
The result of the survey: over 95% of the participants would recommend PRTG – or already have.

Still not convinced?
![]()
More than 500,000
sysadmins love PRTG
Paessler PRTG is used by companies of all sizes. Sysadmins love PRTG because it makes their job a whole lot easier.
![]()
Monitor your entire IT infrastructure
Bandwidth, servers, virtual environments, websites, VoIP services – PRTG keeps an eye on your entire network.
![]()
Try Paessler PRTG
for free
Everyone has different monitoring needs. That’s why we let you try PRTG for free.
![]()
Start monitoring LDAP servers with PRTG and see how it can make your network more reliable and your job easier.
|
PRTG |
Network Monitoring Software - Version 25.1.104.1961 (April 7th, 2025) |
|
Hosting |
Download for Windows and cloud-based version PRTG Hosted Monitor available |
Languages |
English, German, Spanish, French, Portuguese, Dutch, Russian, Japanese, and Simplified Chinese |
Pricing |
Up to 100 sensors for free (Price List) |
Unified Monitoring |
Network devices, bandwidth, servers, applications, virtual environments, remote systems, IoT, and more |
Supported Vendors & Applications |
|
Discover more monitoring insights and stories

Solutions for all your monitoring needs


Combining the broad monitoring feature set of PRTG with IP Fabric’s automated network assurance creates a new level of network visibility and reliability.