![]()
jFlow monitoring with PRTG
Increase network stability and security with in-depth bandwidth analysis
- Identify peak usage times and prevent bottlenecks
- Ensure your bandwidth is used efficiently and securely
- Analyze network traffic by IP address or application
Our users give top ratings for monitoring with Paessler PRTG


PRTG jFlow monitoring: What you’ll find on this page

- PRTG jFlow monitoring helps you get the most out of your network
- 6 reasons why to choose PRTG as your jFlow monitoring tool
- What jFlow network monitoring looks like in PRTG
- How jFlow monitoring with PRTG works
- Explore our preconfigured PRTG sensors for jFlow bandwidth monitoring
- Monitoring jFlow: FAQ
PRTG jFlow monitoring helps you get the most out of your network
By filtering and analyzing your network traffic using jFlow, Paessler PRTG helps you in the following ways:
- Optimize network performance and business processes
- Avoid overloads and protect against network failure
- Make your network more secure by detecting unusual data traffic
- Save money by optimizing bandwidth allocation and resources
PRTG makes jFlow monitoring as easy as it gets
Custom alerts and data visualization let you quickly identify and prevent network overload and potential bottlenecks.
6 reasons why to choose PRTG as your jFlow monitoring tool
jFlow monitoring with PRTG is characterized by minimal bandwidth usage as well as a high degree of detail, and is especially suitable for high traffic networks.
Customizable notifications
Get alerted to errors the way you want: by SMS, email, push notification, and more.
Easier troubleshooting
Faster alerts means you can promptly fix errors and prevent network crashes.
Better network stability
Get empowered to optimize traffic flow, bandwidth usage, and capacity planning.
Increased productivity
Optimized bandwidth usage means more efficient business processes and applications.
Detailed network traffic analysis
Display correlations and traffic patterns in one easy-to-read dashboard.
Stronger network security
Identify suspicious traffic, unauthorized access, and malware to safeguard your network.
What jFlow network monitoring looks like in PRTG
Diagnose network issues by continuously tracking bandwidth utilization on your routers and switches, as well as your entire IT infrastructure. Show flow-based traffic data filtered by IP address, port, and application, and other key metrics in real time. Visualize monitoring data in clear graphs and dashboards to identify problems more easily. Gain the overview you need to troubleshoot issues with the performance of your network.

Device tree view of the complete monitoring setup
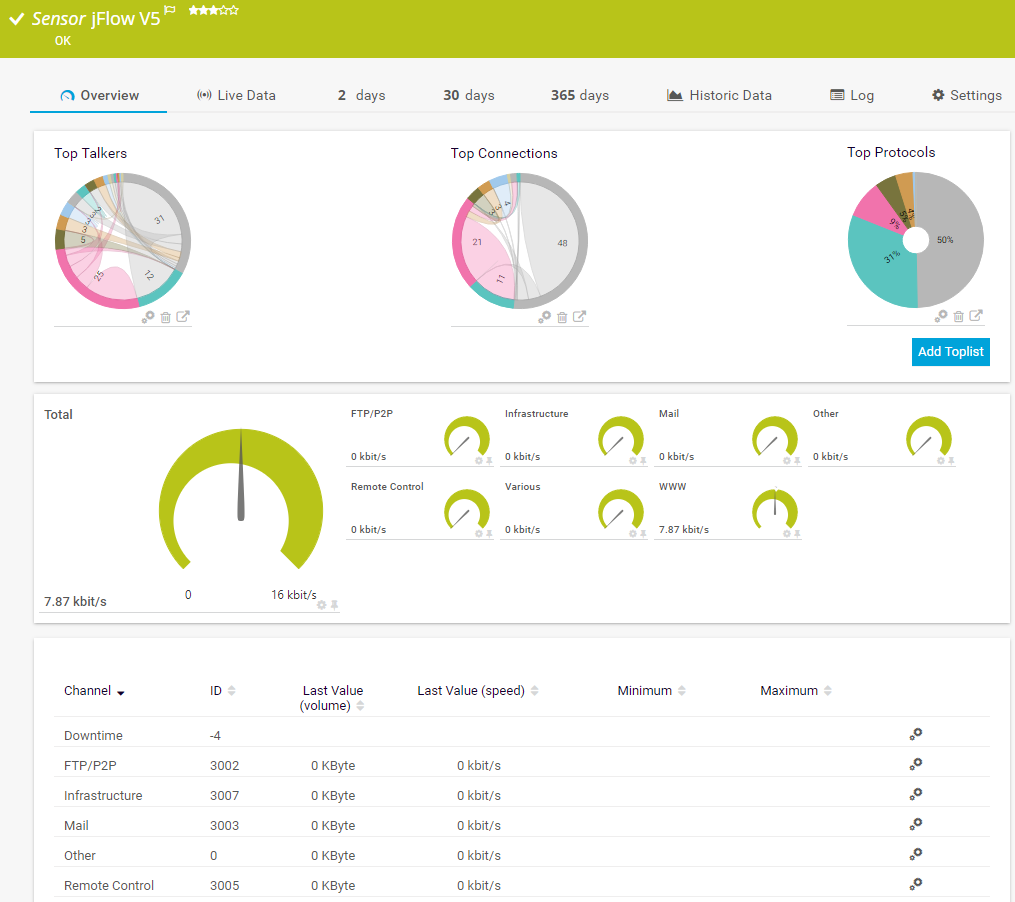
Preconfigured jFlow v5 sensor in PRTG

Custom PRTG dashboard for keeping an eye on the entire IT infrastructure
Start monitoring via jFlow with PRTG and see how it can make your network more reliable and your job easier.
IT experts agree: Paessler PRTG is a great solution for IT infrastructure monitoring

“All-around winning
network monitor”

“The real beauty of PRTG is the endless possibilities it offers”

“PRTG Network Monitor
is very hard to beat”
How jFlow monitoring with PRTG works
During bandwidth monitoring via the jFlow protocol, the router or switch collects data packets and groups them to flows. This information about the flows is sent to PRTG via UDP.
You can sort the flow automatically by traffic type (mail, FTP, or WWW) and use it for statistical processing and visualization. This allows you to immediately see which applications and devices use your bandwidth within your network.
You can also minimize your bandwidth and CPU usage by turning on sampling (if your router supports it) so only every n-th data packet is sent to PRTG.
You detect the originators of the data traffic within your network sorted by sender/target IP, sender/target port, IP protocol, and service type.
The visual presentation of the monitoring data in so-called toplists provides additional optimal analysis conditions. PRTG will immediately alert you to sudden increases of bandwidth usage of a certain network address or application.
Your jFlow monitor at a glance – even on the go
Set up PRTG in minutes and use it on almost any mobile device.


Find the root cause of the problem with our PRTG jFlow monitoring solution
Real-time notifications mean faster troubleshooting so that you can act before more serious issues occur.
PRTG is compatible with all major vendors, products, and systems
![]()
Explore our preconfigured PRTG sensors for jFlow bandwidth monitoring
PRTG comes with more than 250 native sensor types for monitoring your entire on-premises, cloud, and hybrid cloud environment out of the box. Check out some examples below!
Create innovative solutions with Paessler’s partners
Partnering with innovative vendors, Paessler unleashes synergies to create
new and additional benefits for joined customers.


“Excellent tool for detailed monitoring. Alarms and notifications work greatly. Equipment addition is straight forward and server initial setup is very easy. ...feel safe to purchase it if you intend to monitor a large networking landscape.”
Infrastructure and Operations Engineer in the Communications Industry, firm size 10B - 30B USD
PRTG makes jFlow monitoring as easy as it gets
Custom alerts and data visualization let you quickly identify and prevent network overload and potential bottlenecks.

PRTG: The multi-tool for sysadmins
Adapt PRTG individually and dynamically to your needs and rely on a strong API:- HTTP API: Access monitoring data and manipulate monitoring objects via HTTP requests
- Custom sensors: Create your own PRTG sensors for customized monitoring
- Custom notifications: Create your own notifications and send action triggers to external systems
- REST Custom sensor: Monitor almost everything that provides data in XML or JSON format
We asked: would you recommend PRTG?
Over 95% of our customers say yes!
Paessler conducted trials in over 600 IT departments worldwide to tune its network monitoring software closer to the needs of sysadmins.
The result of the survey: over 95% of the participants would recommend PRTG – or already have.

Still not convinced?
![]()
More than 500,000
sysadmins love PRTG
Paessler PRTG is used by companies of all sizes. Sysadmins love PRTG because it makes their job a whole lot easier.
![]()
Monitor your entire IT infrastructure
Bandwidth, servers, virtual environments, websites, VoIP services – PRTG keeps an eye on your entire network.
![]()
Try Paessler PRTG
for free
Everyone has different monitoring needs. That’s why we let you try PRTG for free.
![]()
Start monitoring via jFlow with PRTG and see how it can make your network more reliable and your job easier.
|
PRTG |
Network Monitoring Software - Version 25.1.104.1961 (April 7th, 2025) |
|
Hosting |
Download for Windows and cloud-based version PRTG Hosted Monitor available |
Languages |
English, German, Spanish, French, Portuguese, Dutch, Russian, Japanese, and Simplified Chinese |
Pricing |
Up to 100 sensors for free (Price List) |
Unified Monitoring |
Network devices, bandwidth, servers, applications, virtual environments, remote systems, IoT, and more |
Supported Vendors & Applications |
|
Discover more monitoring insights and stories

Solutions for all your monitoring needs

