Gli avvisi personalizzati e la visualizzazione dei dati consentono di identificare e prevenire rapidamente i problemi mostrati nei file dei registri eventi.
Se volete identificare errori di sistema, applicazione o di servizio, problemi di autenticazione o di permessi, potenziali minacce alla sicurezza e altri problemi che potrebbero avere un impatto sulla salute e sulle prestazioni della rete, i registri eventi di Windows e i syslog possono offrire una grande quantità di informazioni.
Ma quando la vostra rete ha decine di componenti e applicazioni, il volume dei registri eventi di Windows e dei syslog che dovrete esaminare per identificare e risolvere i problemi è... beh, diciamo che fa sembrare Guerra e Pace una breve storia.
I registri completi degli eventi di sicurezza e lo strumento di monitoraggio delle prestazioni di rete di Paessler PRTG tengono sotto controllo ogni singola metrica o variabile che potrebbe avere un impatto sul vostro sistema, in modo che non dobbiate farlo voi.
Inoltre, avendo a disposizione una fonte di verità, sarà molto più facile condurre audit di sicurezza efficaci e dimostrare la conformità.

Niente manuali spessi da leggere o configurazioni complesse. Il rilevamento automatico della rete esegue la scansione dell'intervallo di indirizzi IP scelto, collega ogni componente di rete in quell'intervallo e assegna i sensori appropriati. Non è necessario fare nulla, a meno che non si voglia personalizzare l'ambiente e i parametri.
Perché passare da più visualizzatori di eventi di Windows, sistemi e dashboard di monitoraggio? PRTG riunisce i dati di tutti i registri eventi Windows e i syslog in un unico posto, insieme ad altri dati di rete, tra cui servizi cloud, database SQL, integrazioni di Active Directory e server Windows.
Individuate, risolvete e risolvete rapidamente i problemi, invece di cercare di capirli a posteriori. I sensori preconfigurati di PRTG tracciano metriche chiave basate su soglie e vi avvisano non appena si presentano potenziali problemi, in modo da poterli stroncare sul nascere prima che i vostri colleghi o i vostri clienti se ne accorgano.
La vostra organizzazione opera nel settore dei servizi finanziari, assistenza sanitaria o in altri settori regolamentati? Con un analizzatore di registri eventi completo e potenti automazioni, potete dimostrare in modo tangibile che prendete sul serio i vostri obblighi in materia di dati e i requisiti normativi.
Diagnosticare i problemi di rete monitorando continuamente gli eventi critici nei file di registri eventi di Windows, nei syslog e in altri file di registri. Mostra l'ID dell'evento, il tipo e il livello, la categoria dell'attività, l'origine dell'evento e altre metriche chiave in tempo reale. Visualizzare i dati di monitoraggio in grafici e dashboard chiari per identificare più facilmente i problemi. Ottenere la Panoramica necessaria per risolvere errori e malfunzionamenti del sistema, accessi non autorizzati e altri problemi di sicurezza e prestazioni della rete.

Grafico dei dati di traffico in tempo reale in PRTG

Albero dei dispositivi dell'intera configurazione di monitoraggio

Dashboard PRTG personalizzato per tenere sotto controllo l'intera infrastruttura IT
Grafico dei dati di traffico in tempo reale in PRTG
Albero dei dispositivi dell'intera configurazione di monitoraggio
“Monitor di rete vincente sotto tutti i punti di vista”
“La vera bellezza di PRTG sta nelle infinite possibilità che offre”
“PRTG Network Monitor
è molto difficile da superare”
Utilizzo strumentazione gestione Windows per monitorare i registri eventi di Windows e filtrare le voci dei registri eventi in base a fonti o messaggi specifici per ricevere una notifica in caso di errore. Monitoraggio delle applicazioni Windows, eventi hardware, servizio di gestione delle chiavi, sicurezza, sistema e PowerShell.
Oppure utilizzare le API di Windows per monitorare i file del registro eventi delle applicazioni Windows, del sistema, della sicurezza e del servizio directory, Server DNS e del servizio di replica dei file.
Raccogliere e analizzare i messaggi syslog in arrivo su una porta specifica utilizzando UDP. IT consente di monitorare tutti i messaggi di sistema o solo quelli provenienti da un dispositivo specifico. Impostare le opzioni di filtro per affinare il monitoraggio e determinare se i messaggi sono messaggi di avviso o di errore.
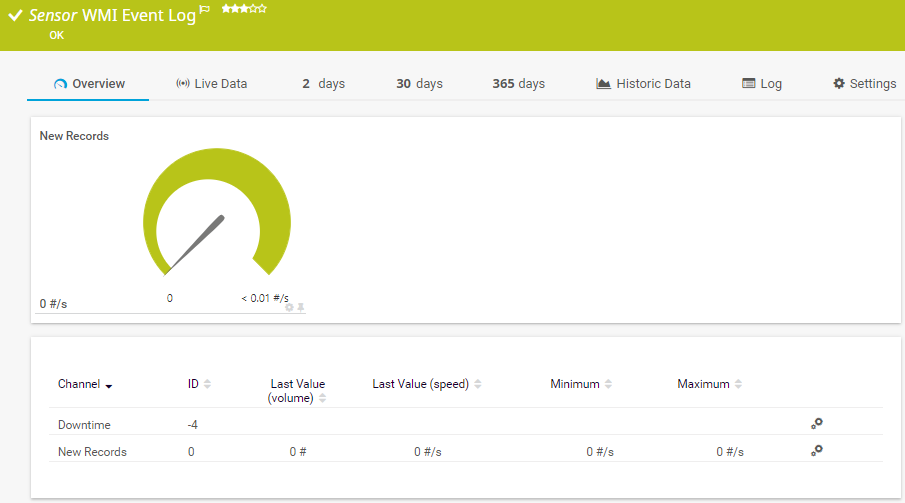
Il sensore WMI Event Log monitora un file di registro di Windows. Può mostrare quanto segue:
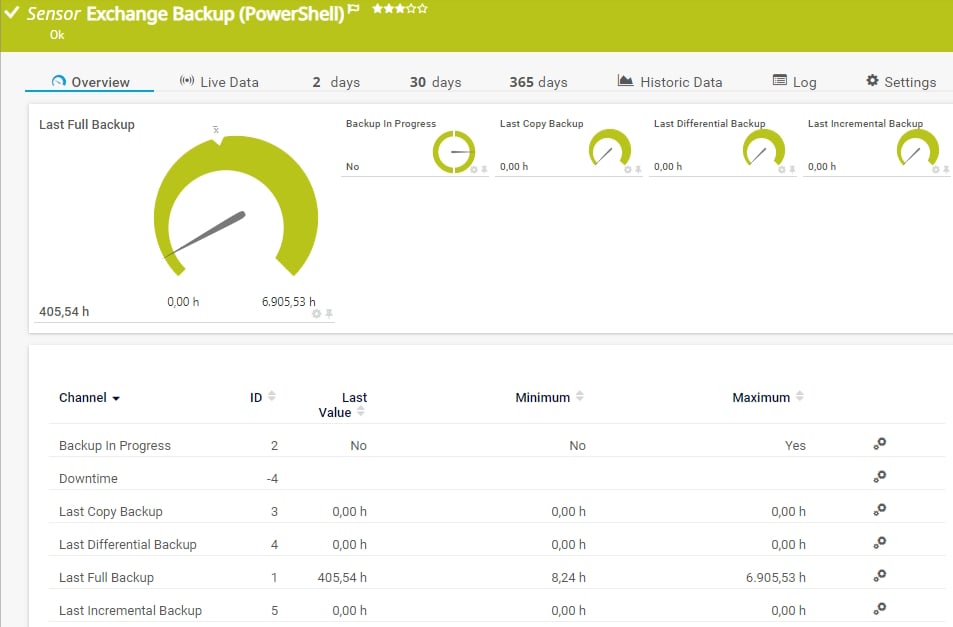
Il sensore Event Log (Windows API) monitora le voci del registro eventi tramite l'API di Windows. Può mostrare quanto segue:
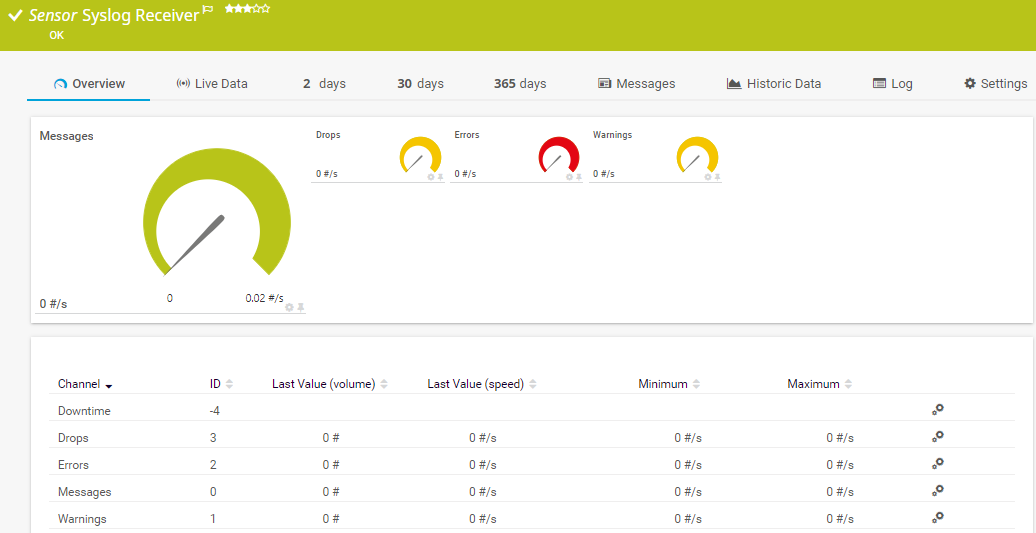
Il sensore Syslog Receiver riceve e analizza i messaggi Syslog. Può mostrare quanto segue:
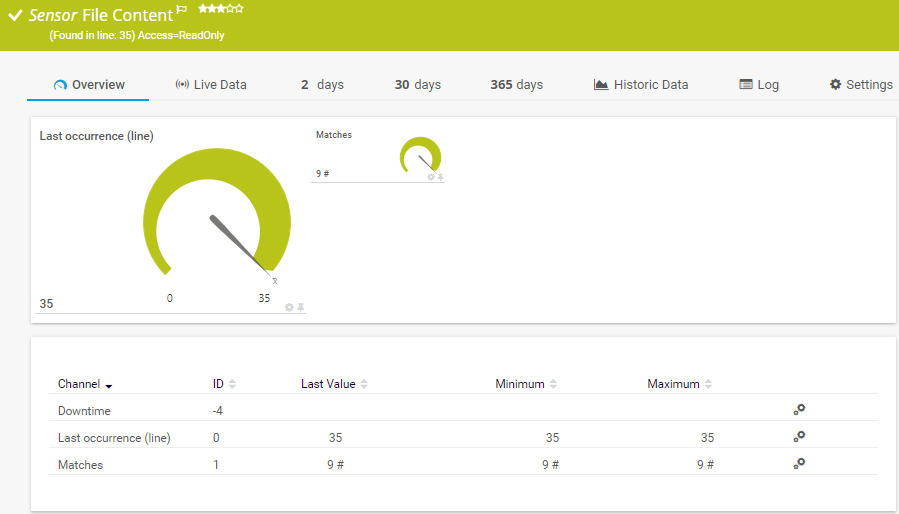
Il sensore File Content controlla un file di testo (ad esempio, un file di log) alla ricerca di determinate stringhe. Può mostrare le seguenti informazioni:
Consulta il manuale di PRTG per un elenco di tutti i tipi di sensore disponibili.

Gli avvisi personalizzati e la visualizzazione dei dati consentono di identificare e prevenire rapidamente i problemi mostrati nei file del registro eventi.
PRTG si configura in pochi minuti e può essere utilizzato su un'ampia gamma di dispositivi mobili.

Grazie alla collaborazione con fornitori IT innovativi, Paessler libera sinergie per creare nuovi e ulteriori vantaggi per i suoi clienti.
La combinazione dell'ampio set di funzioni di monitoraggio di PRTG con la garanzia di rete automatizzata di IP Fabric crea un nuovo livello di visibilità e affidabilità della rete.
L'integrazione dei risultati del monitoraggio di PRTG nelle mappe di NetBrain costituisce la base per l'automazione della rete.
Con ScriptRunner Paessler integra una potente piattaforma di automazione degli eventi in PRTG Network Monitor.
Notifiche in tempo reale significano una risoluzione più rapida dei problemi, in modo da poter intervenire prima che si verifichino problemi più gravi.
Software di monitoraggio della rete – Versione 25.3.110.1313 (August 27, 2025)
Disponibile il download della versione per Windows e della versione cloud-based PRTG Hosted Monitor
Inglese, tedesco, spagnolo, francese, portoghese, olandese, russo, giapponese e cinese semplificato
Dispositivi di rete, larghezza di banda, server, applicazioni, ambienti virtuali, sistemi remoti, IoT e molto altro
Scegli l'abbonamento a PRTG Network Monitor più adatto a te


I registri eventi registrano ciò che accade sul sistema Windows e su altri componenti ed endpoint della rete: il tipo di evento, la sua gravità o importanza, la fonte dell'evento, l'ora in cui si è verificato e l'utente coinvolto nell'evento. IT è come il CCTV per la rete. Solo che gli eventi vengono registrati in forma testuale anziché visiva.
Alcune delle informazioni contenute nei registri eventi includono:
I registri eventi di Windows e i Syslog registrano entrambi ciò che accade sulla rete, ma funzionano in modo diverso e sono adatti ad ambienti diversi.
I registri eventi registrano ciò che accade sul software e sui sistemi che girano su Microsoft Windows, mentre i Syslog sono indipendenti dal sistema operativo (Linux, Unix, macOS). In altre parole, possono registrare ciò che accade su qualsiasi software, sistema o dispositivo, indipendentemente dal sistema operativo utilizzato. I syslog hanno anche un contenuto più flessibile, mentre i registri eventi di Windows seguono in genere una struttura piuttosto rigida con ID evento predefiniti.
Il monitoraggio dei registri eventi è il monitoraggio automatico dei registri eventi. Con PRTG Network Monitor i file di log di tutti i computer della rete vengono monitorati 24 ore su 24. Se si verifica un incidente critico, l'amministratore viene informato immediatamente. Se si verifica un incidente critico, l'amministratore viene informato immediatamente.
La gestione dei registri eventi si riferisce a tutte le attività relative alla gestione dei file di log. In altre parole, la raccolta, il salvataggio, il consolidamento, l'analisi e l'archiviazione dei dati di registro, degli eventi e degli incidenti.
In PRTG, i “sensori” sono gli elementi base del monitoraggio. Un sensore monitora solitamente un valore misurato nella tua rete (ad esempio, il traffico di una porta switch, il carico della CPU di un server o lo spazio libero di un’unità disco). In media, occorrono circa 5-10 sensori per ogni dispositivo o un sensore per ogni porta switch.
Paessler ha condotto prove in oltre 600 dipartimenti IT in tutto il mondo per mettere a punto il suo software di monitoraggio di rete più vicino alle esigenze dei sysadmin. Il risultato è che più del 95% degli intervistati consiglierebbe PRTG – o lo ha già fatto.

Paessler PRTG è utilizzato da aziende di tutte le dimensioni. Gli amministratori di sistema adorano PRTG perché rende il loro lavoro molto più semplice.
Ampiezza di banda, server, ambienti virtuali, siti Web, servizi VoIP - PRTG tiene d'occhio la tua intera rete.
Tutti hanno esigenze di monitoraggio diverse. Ecco perché ti lasciamo provare PRTG gratuitamente. Inizia oggi stesso la tua prova.