Custom alerts and data visualization let you quickly identify and prevent availability, health, and performance issues in remote IT infrastructures.
Resilience. Redundancy. Security. Cost-effectiveness…
There's lots to love about distributed networks. Until something goes wrong, and you spend several days trying to track down where the issue is (in between using lots of colorful language).
Combining sophisticated technology with a clean, intuitive interface, Paessler PRTG empowers you to reap the benefits of distribution, without its downsides. Creating one single source of truth for your entire network, so checking its status, identifying issues, and maintaining optimal network performance is a snap.

PRTG is designed specifically for distributed monitoring, and setting it up is quick and easy. Install your central PRTG server where all monitoring data is securely sent to from all distributed networks.
Then install light-weight remote probes (classic remote probes for Windows systems and multi-platform probes for Linux/Unix and other systems) in the remote locations you want to monitor. Use as many remote probes as you like – they’re included for free.
If it's on your network, PRTG can monitor it. Even if it's several thousands of miles away. Hardware. Websites. Applications. Cloud environments. Virtual environments… You get the idea.
What’s more, PRTG comes with preconfigured sensors for most major manufacturers and service providers, including AWS, Azure, Cisco, Dell, HPE, and many more. But the best part is that it gathers all the data in one central place, so you don't have to flip between multiple environments.
Get in front of issues, before they slow your network to a crawl (and you're flooded with complaints). With PRTG’s custom alerting and notification system, being proactive isn’t just a dream.
Set your preferred warning and error thresholds, and PRTG will monitor availability, health, and performance round the clock, alerting you the second something drops below your chosen metrics or isn't working as it should – no matter in which of your distributed network the error occurs.
Diagnose network issues by continuously tracking servers, applications, routers, switches, firewalls, and other network components in your distributed networks. Show CPU usage, bandwidth, network traffic, and other network performance metrics in real time. Visualize monitoring data in clear graphs and dashboards to identify problems more easily. Gain the visibility you need to troubleshoot issues that arise in distributed IT infrastructures.
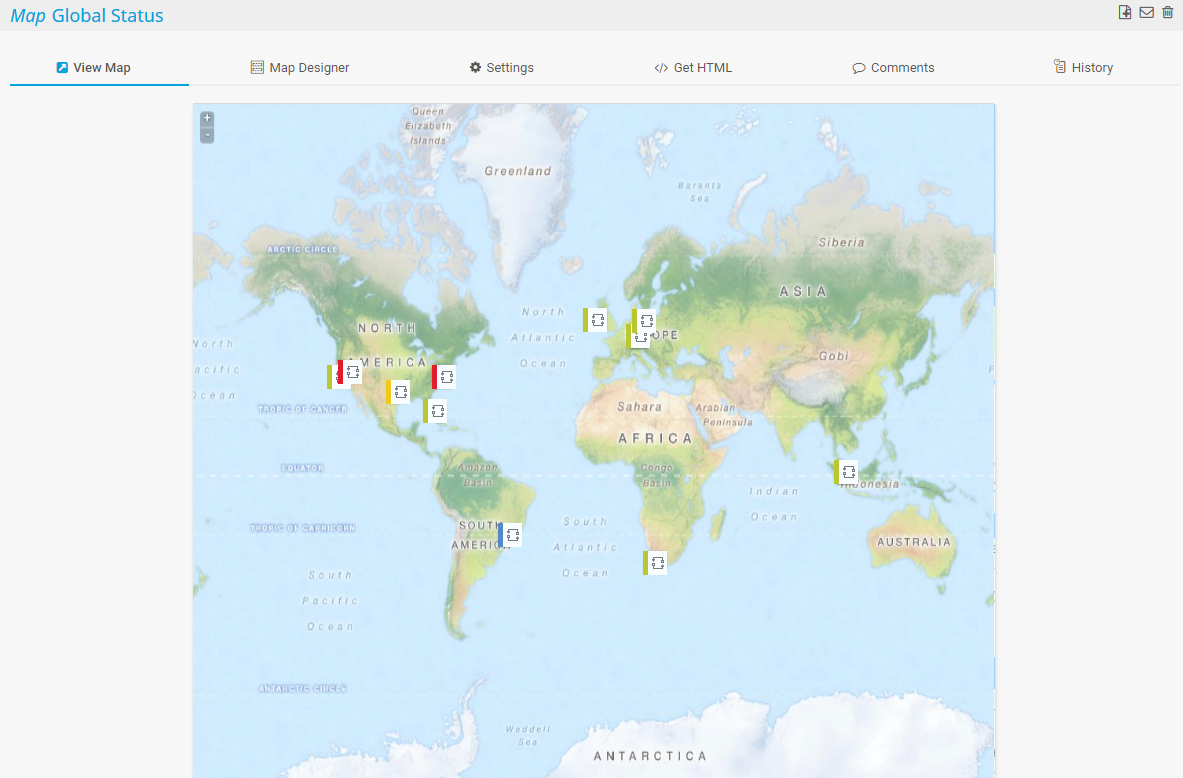
Custom map of the global status

Device tree view of the complete monitoring setup
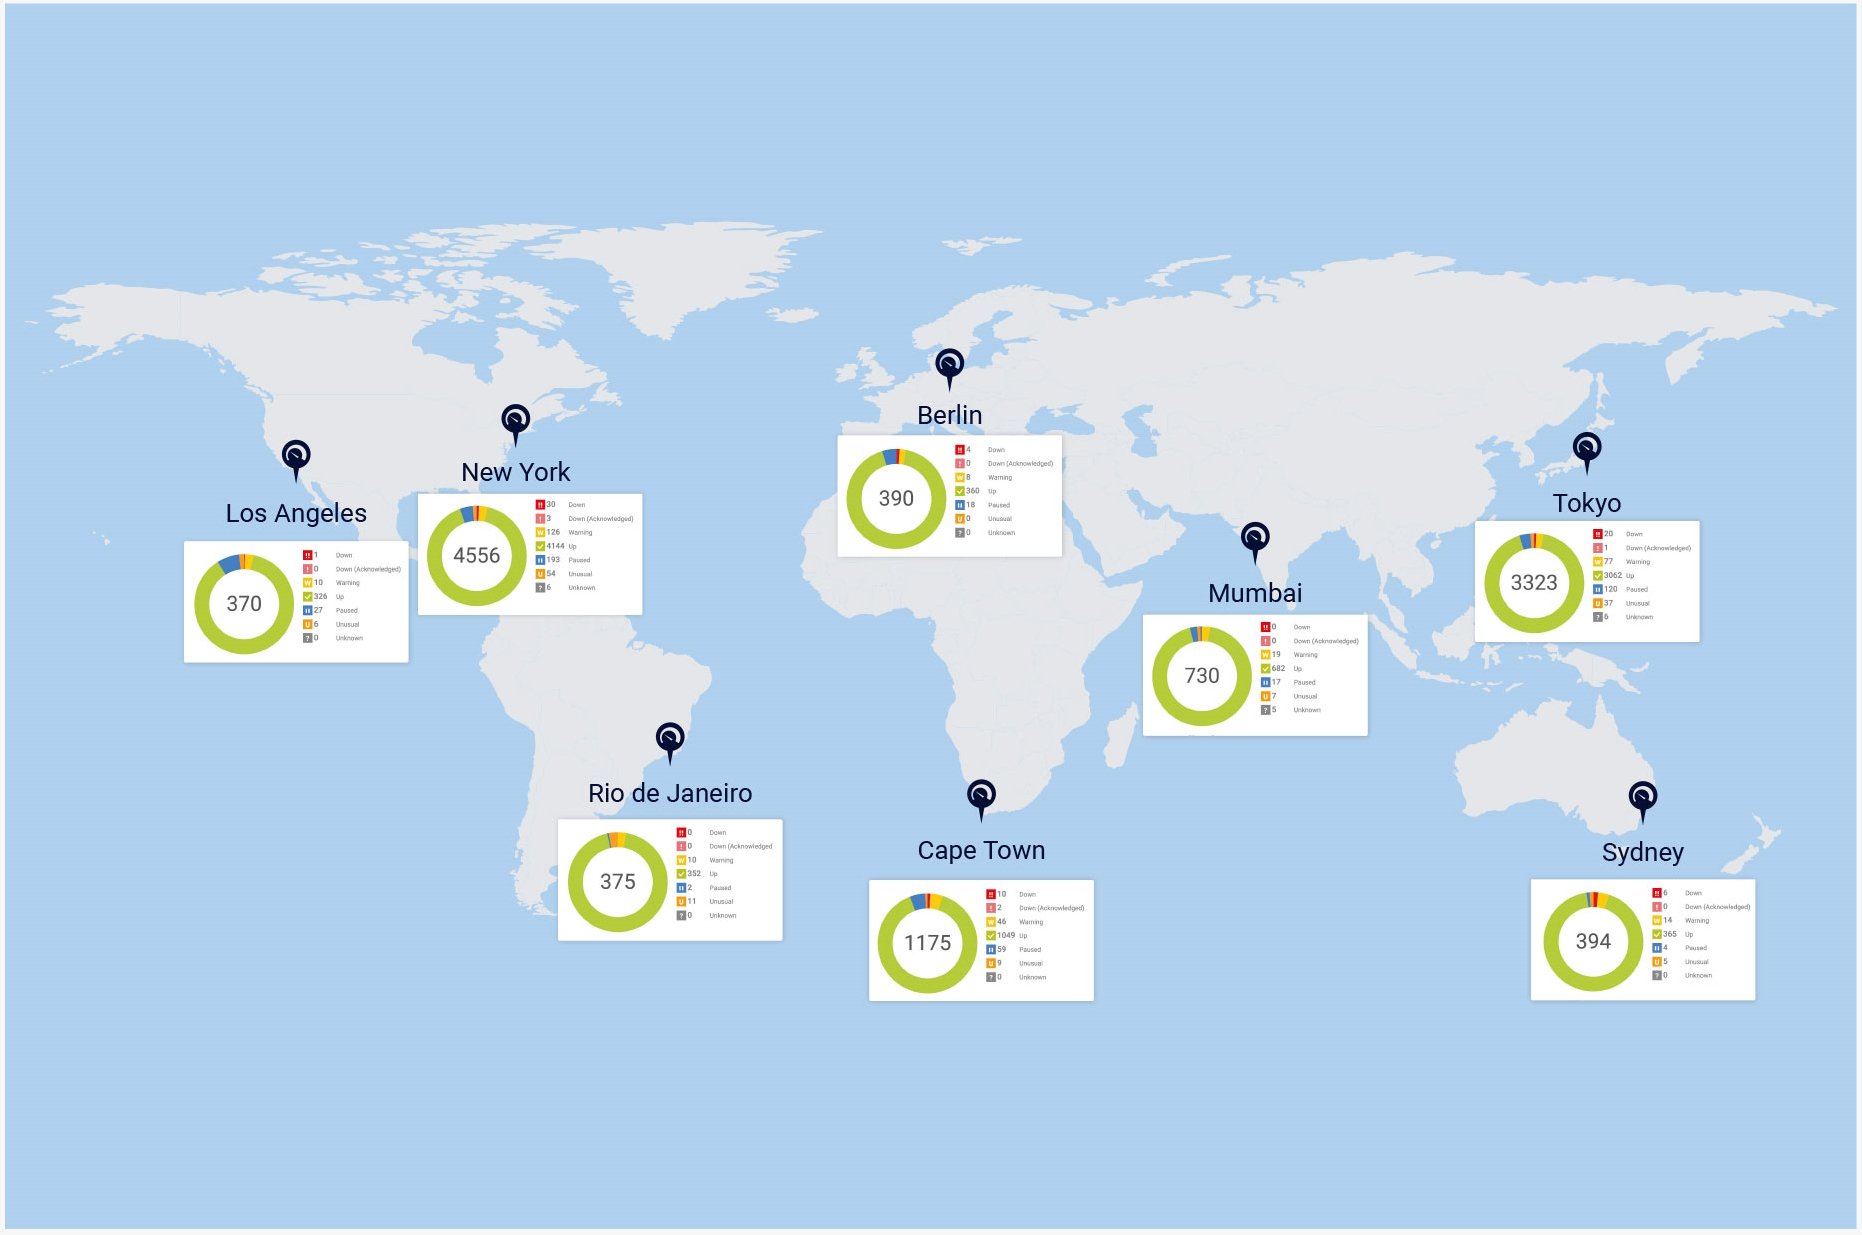
Custom PRTG map for keeping an eye on the entire IT infrastructure
Custom map of the global status
Device tree view of the complete monitoring setup
“All-around winning
network monitor”
“The real beauty of PRTG is the endless possibilities it offers”
“PRTG Network Monitor
is very hard to beat”
Many companies and organizations (such as colleges and municipal institutions) have several branches in the same city, which all have their own LANs.
The IT managers of these establishments want all their major IT systems to be monitored automatically, with all information sent to one central dashboard.
Managed Service Providers (MSPs) operate and monitor IT systems for companies. Among other things, MSPs offer server management, web hosting, network security, and VoIP.
As MSPs oversee multiple customer networks, they need monitoring software that incorporates the data from each and every distributed IT environment.
Large companies usually have offices abroad. These branches often have their own servers and hardware, not to mention websites that must be reachable worldwide.
PRTG monitors hardware, applications, bandwidth, website traffic, and more, no matter how globally a company operates and how many networks need to be included in the monitoring.
PRTG comes with more than 250 native sensor types for monitoring your entire on-premises, cloud, and hybrid cloud environment out of the box. Check out some examples below!
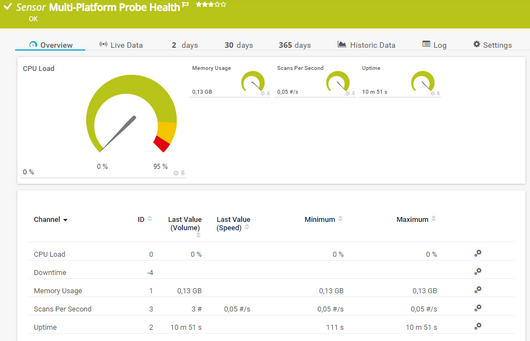
The Probe Health sensor monitors the status of the probe system. It can show the following and more:
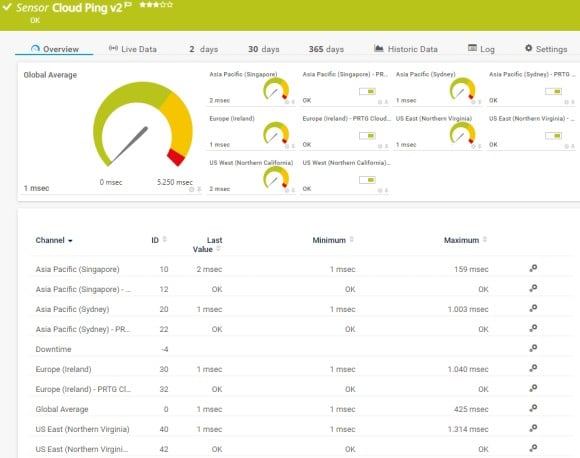
The Cloud Ping v2 sensor monitors the Transmission Control Protocol (TCP) ping times to its parent device from different locations worldwide (Asia Pacific: Singapore, Asia Pacific: Sydney, Europe: Ireland, US East: Northern Virginia, US West: Northern California) via the PRTG Cloud. It can show the following:
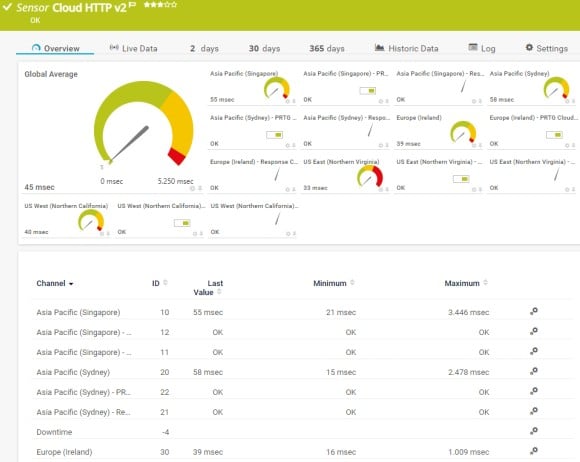
The Cloud HTTP v2 sensor monitors the loading time of a web server via HTTP from different locations worldwide (Asia Pacific: Singapore, Asia Pacific: Sydney, Europe: Ireland, US East: Northern Virginia, US West: Northern California) via the PRTG Cloud. It can show the following:
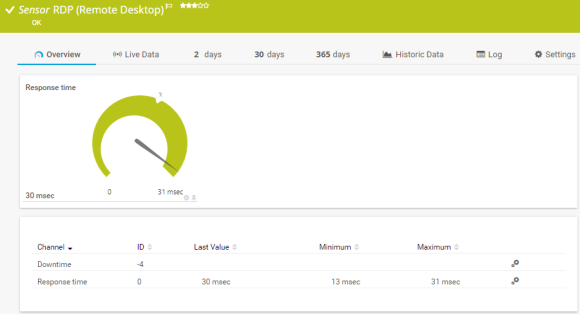
The RDP (Remote Desktop) sensor monitors remote desktop services such as Remote Desktop Protocol (RDP) or Terminal Services Client. It can show the following:
See the PRTG Manual for a list of all available sensor types.
Real-time notifications mean faster troubleshooting so that you can act before more serious issues occur.

How to monitor distributed networks with PRTG
PRTG monitors your distributed network's performance using a system of remote probes that are in constant communication with a central hub – your PRTG core server.
Think of it this way. If your network were an airport, the core server would be the control tower, and the remote probes would be radars, constantly gathering critical data and reporting back so you know exactly what's going on across your network at all times.
The PRTG core server uses sophisticated sensors to monitor the data from your remote probes and alert you should metrics dip below your chosen thresholds. With more than 250 preconfigured sensors to choose from, PRTG can track any value that could impact your network's speed and stability.
And with one core server capable of supporting up to 10,000 sensors (your hardware's specifications permitting), PRTG can handle the largest, most complex distributed network you could think of.
Custom alerts and data visualization let you quickly identify and prevent availability, health, and performance issues in remote IT infrastructures.
Set up PRTG in minutes and use it on almost any mobile device.


“Excellent tool for detailed monitoring. Alarms and notifications work greatly. Equipment addition is straight forward and server initial setup is very easy. ...feel safe to purchase it if you intend to monitor a large networking landscape.”
Partnering with innovative IT vendors, Paessler unleashes synergies to create
new and additional benefits for joined customers.
A combination of Orchestra and PRTG provides the ideal solution to monitor the traditional IT Infrastructure as well as the central communication server in hospitals and industrial environments.

Paessler and Plixer provide a complete solution adding flow and metadata analysis to a powerful network monitoring tool.

Combining PRTG’s broad monitoring feature set with IP Fabric’s automated network assurance creates a new level of network visibility and reliability.
Real-time notifications mean faster troubleshooting so that you can act before more serious issues occur.
Network Monitoring Software – Version 24.4.102.1351 (November 12th, 2024)
Download for Windows and cloud-based version PRTG Hosted Monitor available
English, German, Spanish, French, Portuguese, Dutch, Russian, Japanese, and Simplified Chinese
Network devices, bandwidth, servers, applications, virtual environments, remote systems, IoT, and more
Choose the PRTG Network Monitor subscription that's best for you


Distributed network monitoring involves using multiple monitoring probes spread across various locations in a network to collect and analyze data. This decentralized approach enhances visibility and reliability by ensuring that network performance, security, and health can be assessed from multiple points, reducing the risk of blind spots. Each probe reports back to a central system, providing a comprehensive view of the network's status. It is especially useful for large, complex, or geographically dispersed networks.
Centralized monitoring of distributed networks offers several benefits:
Paessler PRTG is proprietary software that takes the effort out of ensuring your network always performs at its best. Available for Windows-based on-premises servers or as a cloud-hosted solution, it's capable of monitoring unlimited local and remotely-connected devices, bringing critical system data together in one simple, intuitive interface you can access from anywhere: at the office, at home, or on the go.
Yes. While you can still only install a PRTG core server on Windows (or use our cloud-based, hosted monitoring solution PRTG Hosted Monitor), our brand-new, free multi-platform probe is especially designed for monitoring on Linux and other Unix-based systems.
In PRTG, “sensors” are the basic monitoring elements. One sensor usually monitors one measured value in your network, for example the traffic of a switch port, the CPU load of a server, or the free space on a disk drive. On average, you need about 5-10 sensors per device or one sensor per switch port.
Paessler conducted trials in over 600 IT departments worldwide to tune its network monitoring software closer to the needs of sysadmins. The result of the survey: over 95% of the participants would recommend PRTG – or already have.

Paessler PRTG is used by companies of all sizes. Sysadmins love PRTG because it makes their job a whole lot easier.
Bandwidth, servers, virtual environments, websites, VoIP services – PRTG keeps an eye on your entire network.
Everyone has different monitoring needs. That’s why we let you try PRTG for free.