


Custom alerts and data visualization let you quickly identify network issues at one glance.
Maintaining a stable, reliable network without keeping a close eye on key health and performance metrics is like trying to drive a car blindfolded.
But it’s not the data itself that makes the difference. It’s being able to quickly grasp what that data is telling you. The easier it is to understand and digest, the more effective you’ll be as a system administrator, and, in turn, the more stable and reliable your network will be.
Paessler PRTG’s graphical network mapping and monitoring is designed to present critical information as intuitively as possible, so you can easily discover what’s going on in your network at any point in time.
Create your own topology maps, use preconfigured or custom toplists for quick reference, and design a network monitoring environment that works for you, instead of an environment you have to work around.

Set up in minutes. The automatic network discovery detects every network device within a given IP address range, assigns the appropriate sensors, and builds a network topology. Once you're up and running, you can configure performance thresholds and tailor dashboards and other visuals to suit.
See what's happening across your network, right now and in color. PRTG's sophisticated sensors collect live data from your network infrastructure round the clock, giving you comprehensive, pinpoint-accurate oversight and simplifying network management.
Tailor every visual component of the PRTG web interface so it meets your exact needs. Monitoring dashboards. Graphs. Maps. Color-coded status indicators. Toplists. Heatmaps. You can even import your own graphics, images, and HTML elements.
PRTG's customization capabilities don't stop with visuals. You can also build tailor-made reports for your higher-ups with a few clicks, and export them in your preferred format – CSV, XML, HTML, and even PDF. Oh, and you can add graphs and other custom visuals to them, too.
Diagnose network issues by continuously tracking servers, routers, virtual machines, and other hardware and software components across your network. Show server status, uptime, bandwidth usage, data transfer speeds, and other key metrics in real time. Visualize monitoring data in clear graphs and dashboards to identify problems more easily. Gain the overview you need to troubleshoot bottlenecks, latency, server overload, and other network problems.
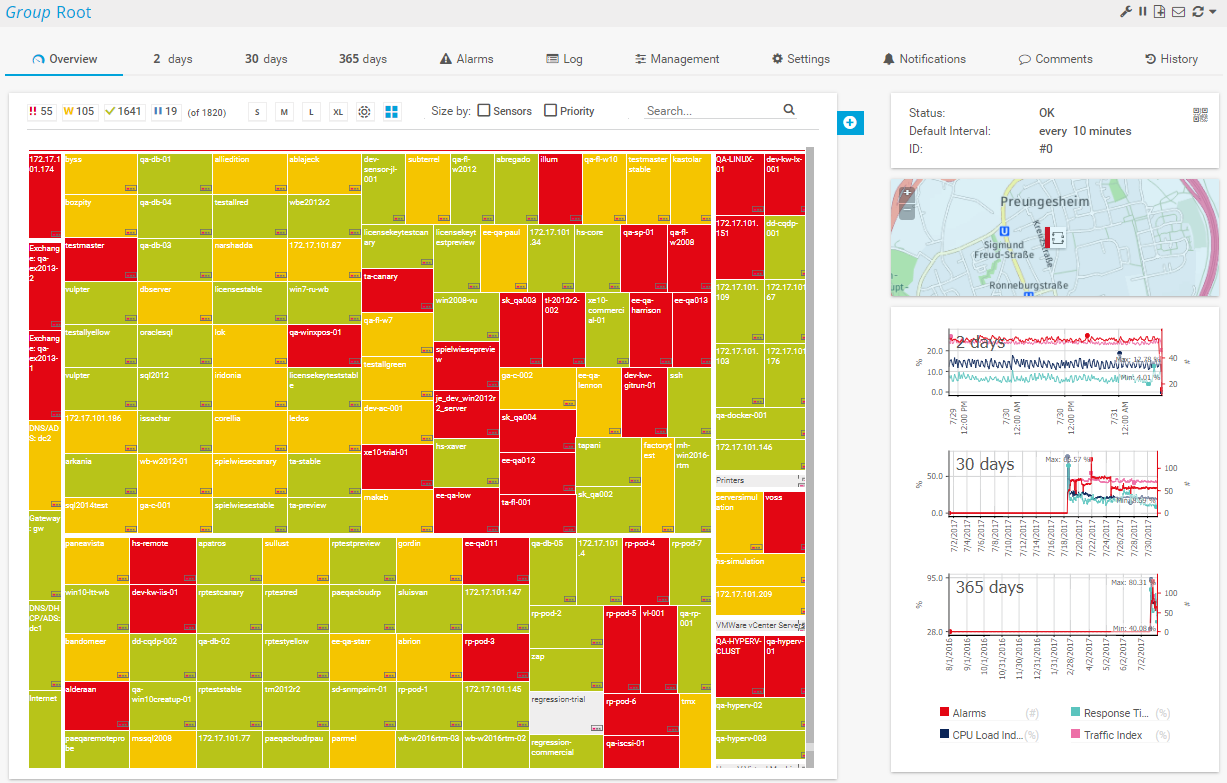
Tree map view in PRTG

Device tree view of the complete monitoring setup

Custom PRTG dashboard for keeping an eye on the entire IT infrastructure

Live traffic data graph in PRTG
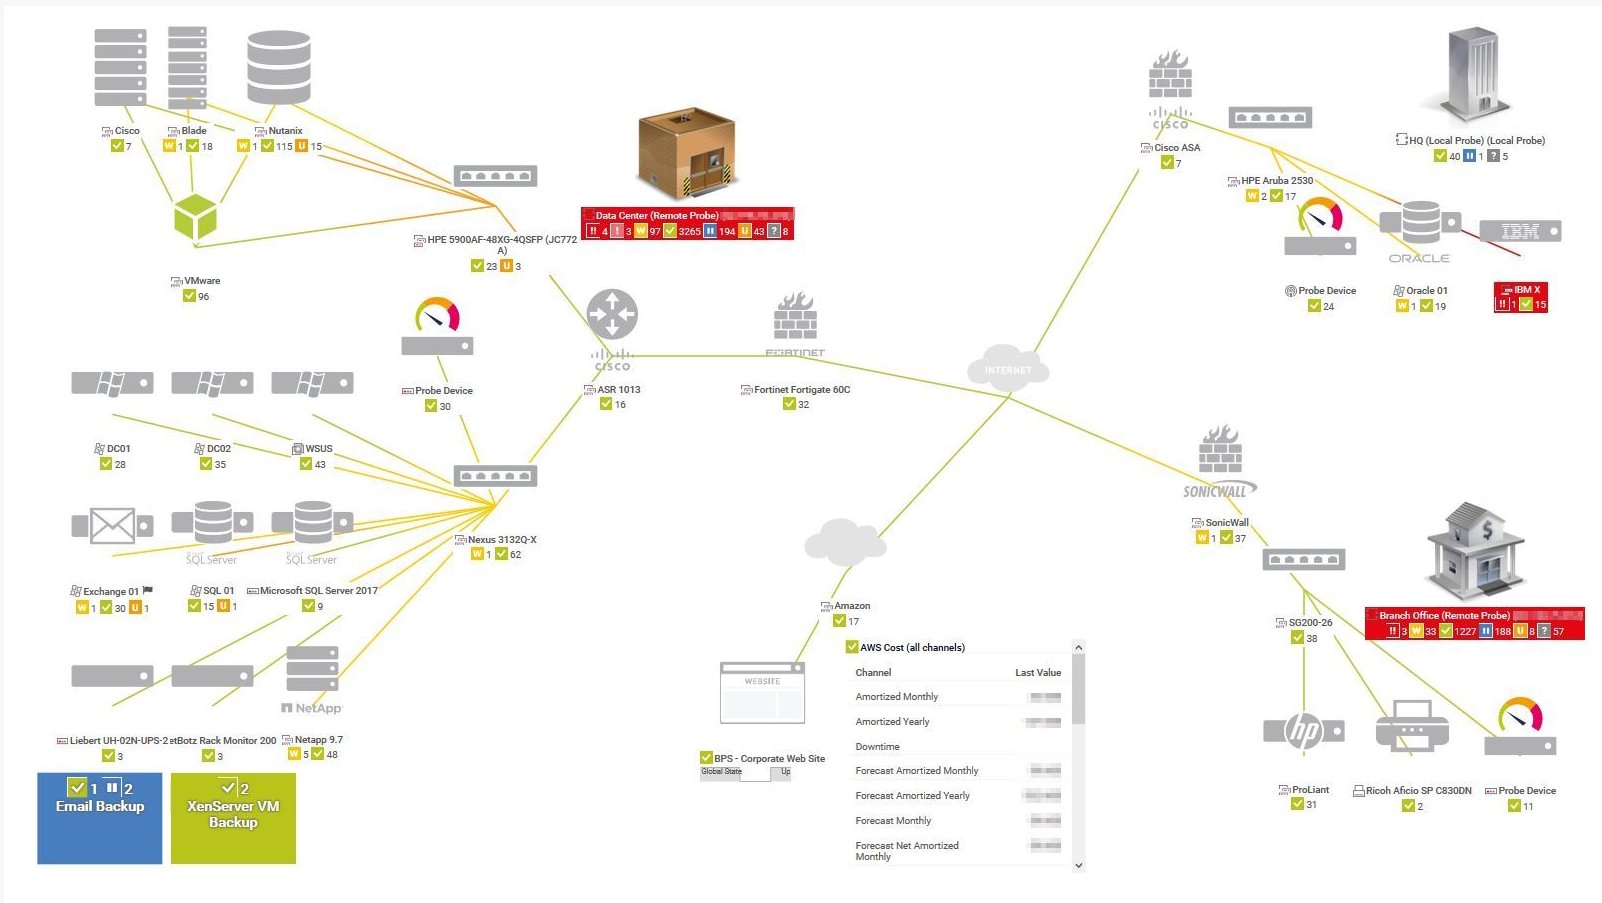
Network topology in PRTG
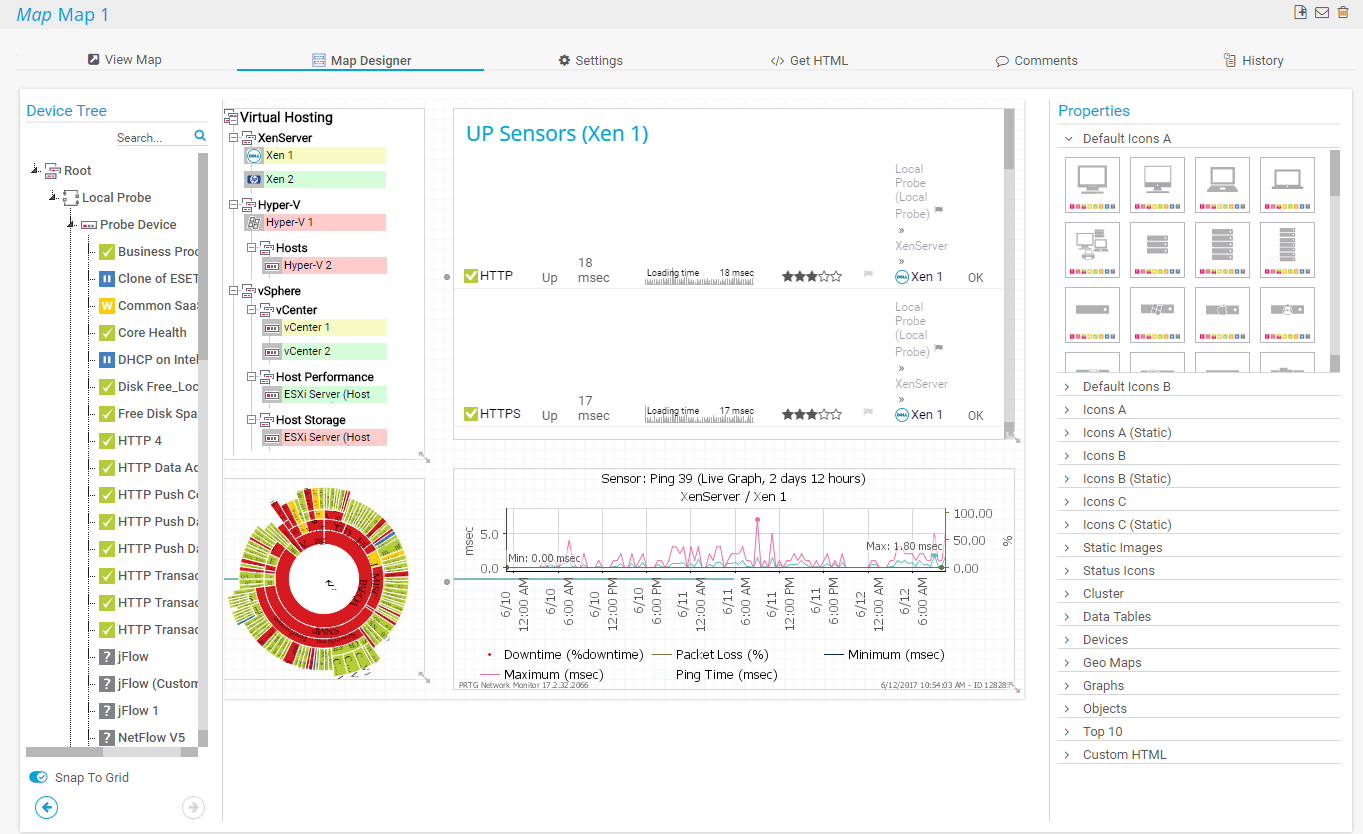
Map designer in PRTG
Tree map view in PRTG
Device tree view of the complete monitoring setup
“All-around winning
network monitor”
“The real beauty of PRTG is the endless possibilities it offers”
“PRTG Network Monitor
is very hard to beat”
Network performance monitoring doesn’t get any easier than this.
With preconfigured sensors and device templates, and support for all major protocols – SNMP, WMI, Windows performance counters, NetFlow, HTTP, and many more – our network monitoring software can track every variable imaginable, including:
Pick your preferred performance thresholds, and PRTG keeps a continuous eye on key metrics, alerting you when they’re at risk of falling under or over.

Custom alerts and data visualization let you quickly identify network issues at one glance.
PRTG is set up in a matter of minutes and can be used on a wide variety of mobile devices.

Partnering with innovative IT vendors, Paessler unleashes synergies to create
new and additional benefits for joined customers.

Combining PRTG’s broad monitoring feature set with IP Fabric’s automated network assurance creates a new level of network visibility and reliability.

Paessler and Plixer provide a complete solution adding flow and metadata analysis to a powerful network monitoring tool.

With ScriptRunner Paessler integrates a powerful event automation platform into PRTG Network Monitor.
Real-time notifications mean faster troubleshooting so that you can act before more serious issues occur.
Network Monitoring Software – Version 24.4.102.1351 (November 12th, 2024)
Download for Windows and cloud-based version PRTG Hosted Monitor available
English, German, Spanish, French, Portuguese, Dutch, Russian, Japanese, and Simplified Chinese
Network devices, bandwidth, servers, applications, virtual environments, remote systems, IoT, and more
Choose the PRTG Network Monitor subscription that's best for you


PRTG is a proprietary software tool that tracks all your network infrastructure’s key health and performance metrics – firewall analyzer, routers, network connections, network bandwidth monitoring, latency, network traffic monitoring... you name it – and organizes them into graphs, charts, and other visualizations.
Available for Windows-based on-premises servers or as a cloud-hosted solution, PRTG is capable of monitoring unlimited local, remote, and virtual network devices, bringing critical system data together in one simple, intuitive interface you can access from anywhere: at the office, at home, or on the go.
Because it gives you a complete, blow-by-blow view of your network's performance, presented in an easy-to-understand format. Seeing complex network data arranged in a graph, chart, dashboard, or other visual helps you digest it more quickly. Which means you can proactively optimize your resources, plan ahead with confidence, and carry out troubleshooting with less effort.
Using both network mapping and network monitoring helps admins visualize network dependencies and track important performance metrics, leading to more efficient troubleshooting and minimized downtime. This synergy ensures a comprehensive view of the network and enables a proactive management and quicker resolution of issues.
In PRTG, “sensors” are the basic monitoring elements. One sensor usually monitors one measured value in your network, for example the traffic of a switch port, the CPU load of a server, or the free space on a disk drive. On average, you need about 5-10 sensors per device or one sensor per switch port.
Paessler conducted trials in over 600 IT departments worldwide to tune its network monitoring software closer to the needs of sysadmins. The result of the survey: over 95% of the participants would recommend PRTG – or already have.

Paessler PRTG is used by companies of all sizes. Sysadmins love PRTG because it makes their job a whole lot easier.
Bandwidth, servers, virtual environments, websites, VoIP services – PRTG keeps an eye on your entire network.
Everyone has different monitoring needs. That’s why we let you try PRTG for free.
