PRTG Manual: SNMP Cisco ASA VPN Users Sensor
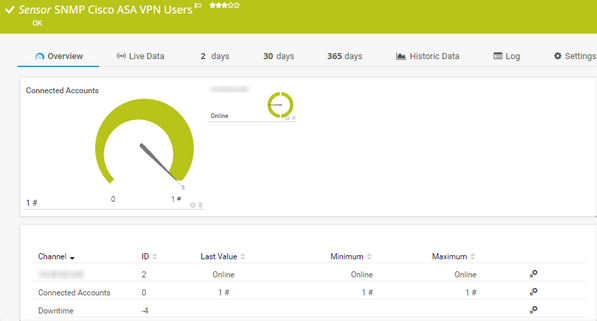
The SNMP Cisco ASA VPN Users sensor monitors account connections to a VPN on a Cisco Adaptive Security Appliance via the Simple Network Management Protocol (SNMP).
For a detailed list and descriptions of the channels that this sensor can show, see section Channel List.
- Dutch: SNMP Cisco ASA VPN Gebruikers
- French: Cisco ASA utilisateurs VPN (SNMP)
- German: SNMP Cisco ASA VPN-Benutzer
- Japanese: SNMP Cisco ASA VPN ユーザー数
- Portuguese: Usuários VPN Cisco ASA (SNMP)
- Russian: Пользователи SNMP Cisco ASA VPN
- Simplified Chinese: SNMP Cisco ASA VPN 用户
- Spanish: Usuarios VPN Cisco ASA (SNMP)
Consider the following remarks and requirements for this sensor:
Remark |
Description |
|---|---|
VPN users |
Do not use this sensor to monitor more than 50 VPN users, especially if they are all connected simultaneously. For more information, see the Knowledge Base: My SNMP Cisco ASA VPN Users sensor shows a user limit error. Why? What can I do? |
IPv6 |
This sensor supports IPv6. |
Performance impact |
This sensor has a low performance impact. |
The sensor has the following default tags that are automatically predefined in the sensor's settings when you add the sensor:
- snmpciscoasavpnsensor
- snmpciscoasavpntrafficsensor
For more information about basic sensor settings, see section Sensor Settings.
Setting |
Description |
|---|---|
Primary Channel |
Select a channel from the list to define it as the primary channel. In the device tree, PRTG displays the last value of the primary channel below the sensor's name. The available options depend on what channels are available for this sensor.
|
Graph Type |
Define how this sensor shows different channels:
|
Stack Unit |
This setting is only visible if you select Stack channels on top of each other above. Select a unit from the list. PRTG stacks all channels with this unit on top of each other. By default, you cannot exclude single channels from stacking if they use the selected unit. However, there is an advanced procedure to do so. |
By default, all of these settings are inherited from objects that are higher in the hierarchy. We recommend that you change them centrally in the root group settings if necessary. To change a setting for this object only, click ![]() under the corresponding setting name to disable the inheritance and to display its options.
under the corresponding setting name to disable the inheritance and to display its options.
For more information, see section Inheritance of Settings.
Which channels the sensor actually shows might depend on the target device, the available components, and the sensor setup.
Channel |
Description |
|---|---|
[Account] |
The account status
|
Connected Accounts |
The number of connected accounts
|
Downtime |
In the channel table on the Overview tab, this channel never shows any values. PRTG uses this channel in graphs and reports to show the amount of time in which the sensor was in the Down status. |
KNOWLEDGE BASE
My SNMP Cisco ASA VPN Users sensor shows a user limit error. Why? What can I do?
What security features does PRTG include?
My SNMP sensors don’t work. What can I do?


