Custom alerts and data visualization let you quickly identify and prevent data traffic and network congestion issues.
Diagnose network issues by continuously tracking network traffic data. Show network congestions, bandwidth bottlenecks , and other key metrics real time. Visualize monitoring data in clear graphs and dashboards to identify problems more easily. Gain the overview you need to troubleshoot your network’s health, downtime, and all kinds of performance issues.

Live traffic data graph in PRTG

Device tree view of the complete monitoring setup

Custom PRTG dashboard for keeping an eye on the entire IT infrastructure
Live traffic data graph in PRTG
Device tree view of the complete monitoring setup
“All-around winning
network monitor”
“The real beauty of PRTG is the endless possibilities it offers”
“PRTG Network Monitor
is very hard to beat”
PRTG continuously consolidates all your monitoring information into an easy-to-read, customizable dashboard. A quick glance anywhere, anytime is all it takes to know that everything is OK.
Thanks to the Auto-Discovery feature, which pings a specific range of IP addresses in your subnet, you can set up PRTG in minutes and immediately start checking your network traffic.
PRTG comes with over 250 predefined sensor types and also offers customizable sensors that can monitor the metrics which are most important to your company.
PRTG promptly alerts you if your traffic increases and risks causing problems in your network. Its built-in alarm functionality acts fast and alerts you via SMS, text, push notification, and more sif thresholds are breached.
Unlike command line tools such as Traceroute and Tracert, which are used selectively, PRTG continuously monitors your entire IT infrastructure.
In the event of delays, disruptions, or crashes, PRTG immediately sounds the alarm and notifies you however you like: via email, SMS, push notification, and more.
There are many possible reasons for a data packet not reaching its destination. With PRTG, troubleshooting is faster and easier due to continuous monitoring and fast alarms.
PRTG comes with more than 250 native sensor types for monitoring your entire on-premises, cloud, and hybrid cloud environment out of the box. Check out some examples below!
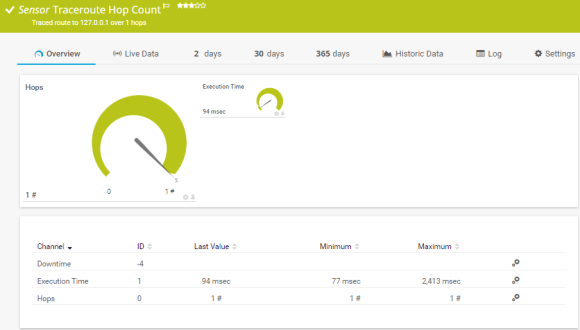
The Traceroute Hop Count sensor traces the number of hops from the probe system to the IP Address/DNS Name of the parent device. It can show the following:
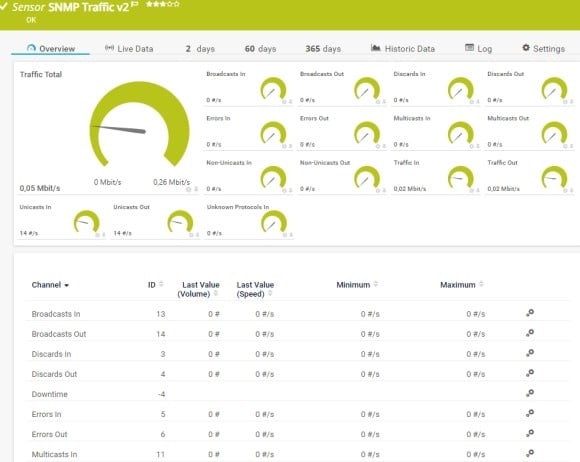
The SNMP Traffic v2 sensor monitors bandwidth and traffic on a device. It can show the following:
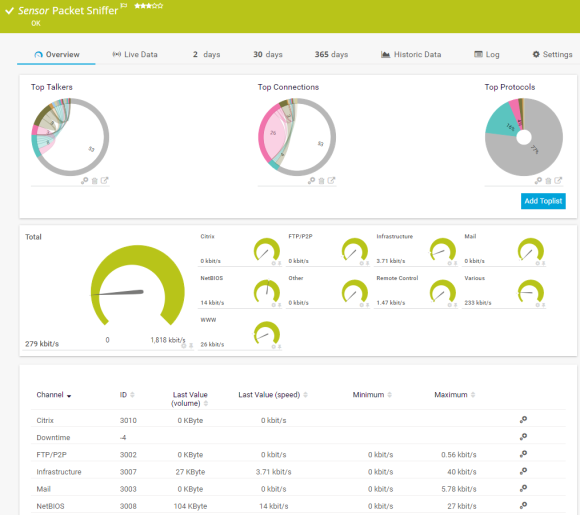
The Packet Sniffer sensor monitors the headers of data packets that pass a local network card using a built-in packet sniffer. You can choose from predefined channels. It can show the following and more:
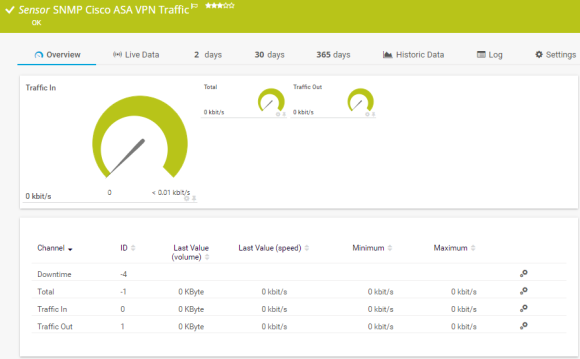
The SNMP Cisco ASA VPN Traffic sensor monitors the traffic of an Internet Protocol Security (IPsec) VPN connection on a Cisco Adaptive Security Appliance. It can show the following:
See the PRTG Manual for a list of all available sensor types.
Real-time notifications mean faster troubleshooting so that you can act before more serious issues occur.

PRTG lets you perform a traceroute on a specific server or network device with just 2 clicks.
Note: The target device must be incorporated into your monitoring.
PRTG will then perform a traceroute on the target device and display the results in a matter of seconds.
Set up PRTG in minutes and use it on almost any mobile device.


“Excellent tool for detailed monitoring. Alarms and notifications work greatly. Equipment addition is straight forward and server initial setup is very easy. ...feel safe to purchase it if you intend to monitor a large networking landscape.”
Partnering with innovative IT vendors, Paessler unleashes synergies to create
new and additional benefits for joined customers.

Combining PRTG’s broad monitoring feature set with IP Fabric’s automated network assurance creates a new level of network visibility and reliability.

Rhebo and PRTG offer a comprehensive monitoring solution for IT and OT environments: from condition monitoring through to anomaly and threat detection.

UVexplorer integrates tightly with PRTG to bring fast and accurate network discovery, detailed device inventory, and automatic network mapping to the PRTG platform.
Custom alerts and data visualization let you quickly identify and prevent data traffic and network congestion issues.
Network Monitoring Software – Version 24.4.102.1351 (November 12th, 2024)
Download for Windows and cloud-based version PRTG Hosted Monitor available
English, German, Spanish, French, Portuguese, Dutch, Russian, Japanese, and Simplified Chinese
Network devices, bandwidth, servers, applications, virtual environments, remote systems, IoT, and more
Choose the PRTG Network Monitor subscription that's best for you


A network traffic tracer, also known as a network traffic analyzer or packet sniffer, is a tool used to capture and analyze data packets flowing through a computer network. It allows users to monitor and inspect the traffic for various purposes, including troubleshooting network issues, monitoring network performance, and detecting security threats such as intrusion attempts or malware.
By capturing and analyzing packet headers and payloads, network traffic tracers provide insights into network behavior, helping administrators understand traffic patterns and identify abnormalities.
No. Paessler PRTG is proprietary network monitoring software that can keep an eye on your entire IT infrastructure, including:
Network traffic monitoring involves real-time observation and analysis of data packets flowing through a network. It provides administrators with immediate insights into network performance, utilization, and security incidents. Monitoring tools like Paessler PRTG typically display live network activity and may include features like traffic visualization, alerting, and real-time statistics.
On the other hand, network traffic recording involves capturing and storing data packets for later analysis. It allows administrators to review past network activity, investigate security incidents, and troubleshoot issues retrospectively. Recorded traffic can be analyzed using various tools and techniques, providing a detailed view of network behavior over time.
Trace Route (or “Traceroute”) is a command line tool in Linux/Unix that lets you trace the route of data in your network. Individual hops are captured and recorded. As a result, you can identify bottlenecks and disruptions.
A similar command line tool exists for Windows. This tool is called “Tracert,” which also allows you to determine the path of data packets by entering commands in the command line. For example, Tracert can let you pinpoint where a data packet got delayed.
In PRTG, “sensors” are the basic monitoring elements. One sensor usually monitors one measured value in your network, for example the traffic of a switch port, the CPU load of a server, or the free space on a disk drive. On average, you need about 5-10 sensors per device or one sensor per switch port.
Paessler conducted trials in over 600 IT departments worldwide to tune its network monitoring software closer to the needs of sysadmins. The result of the survey: over 95% of the participants would recommend PRTG – or already have.

Paessler PRTG is used by companies of all sizes. Sysadmins love PRTG because it makes their job a whole lot easier.
Bandwidth, servers, virtual environments, websites, VoIP services – PRTG keeps an eye on your entire network.
Everyone has different monitoring needs. That’s why we let you try PRTG for free.