Custom alerts and data visualizations let you quickly identify and prevent the causes of packet loss and proactively fix packet loss issues.
Static-filled calls. Dropped connections. Missing files. Corrupted data.
Packet loss can cause trouble across your organization and make it impossible for everyone to do their jobs. But you won't know it's a problem unless you check.
Paessler PRTG monitors your network – including your internet connection – round the clock and alerts you if there are issues you need to fix, so you can ensure it continues to perform at 100%.

PRTG is precision-engineered to detect the slightest packet delays, lags, and timeouts. But our packet loss monitoring tool also monitors duplicate packets, ethernet latency, and even VoIP jitter, reducing the risk a colleague's face will freeze awkwardly during an important call.
Keep your network stable, with just a slight effort. Once you set up PRTG, it works in the background, twenty-four hours a day. Ensuring everything's working as it should and alerting you of issues promptly, so you can fix them before anyone can notice.
PRTG also keeps an eye on your traffic, bandwidth, device availability, server load, hardware, and applications. With 250+ preconfigured sensors, monitoring every aspect of your network's health and performance is as simple and straightforward as it gets.
Diagnose network issues by continuously tracking network packet loss. Show network latency, throughput, network traffic, Wi-Fi internet speed, and other key metrics in real time. Visualize monitoring data in clear graphs and dashboards to identify problems more easily. Gain the overview you need to troubleshoot network congestions, bad VoIP calls, slow network speed, and various packet loss issues.

Live traffic data graph in PRTG

Device tree view of the complete monitoring setup

Custom PRTG dashboard for keeping an eye on the entire IT infrastructure
Live traffic data graph in PRTG
Device tree view of the complete monitoring setup
“All-around winning
network monitor”
“The real beauty of PRTG is the endless possibilities it offers”
“PRTG Network Monitor
is very hard to beat”
Our sophisticated QoS (Quality of Service) One Way sensor continuously monitors the quality of a network connection by measuring the packet loss rate between two probes.
You can monitor any connection in your network and measure packet loss on this route by setting up PRTG remote probes close to the route’s endpoints and adding a QoS sensor. The sensor will automatically send data packets between the two probes and alert you if performance falls below your defined threshold.
Can't (or won't) create remote probes on more Windows systems? No problem. PRTG's quality-of-service reflector can do it via a Python script that sends packets from your chosen endpoints back to PRTG.
The script can be used on any (Linux) computer, even a small Raspberry Pi. For more information, see our Knowledge Base: How can I monitor QoS round trips without using remote probes?
PRTG comes with more than 250 native sensor types for monitoring your entire on-premises, cloud, and hybrid cloud environment out of the box. Check out some examples below!
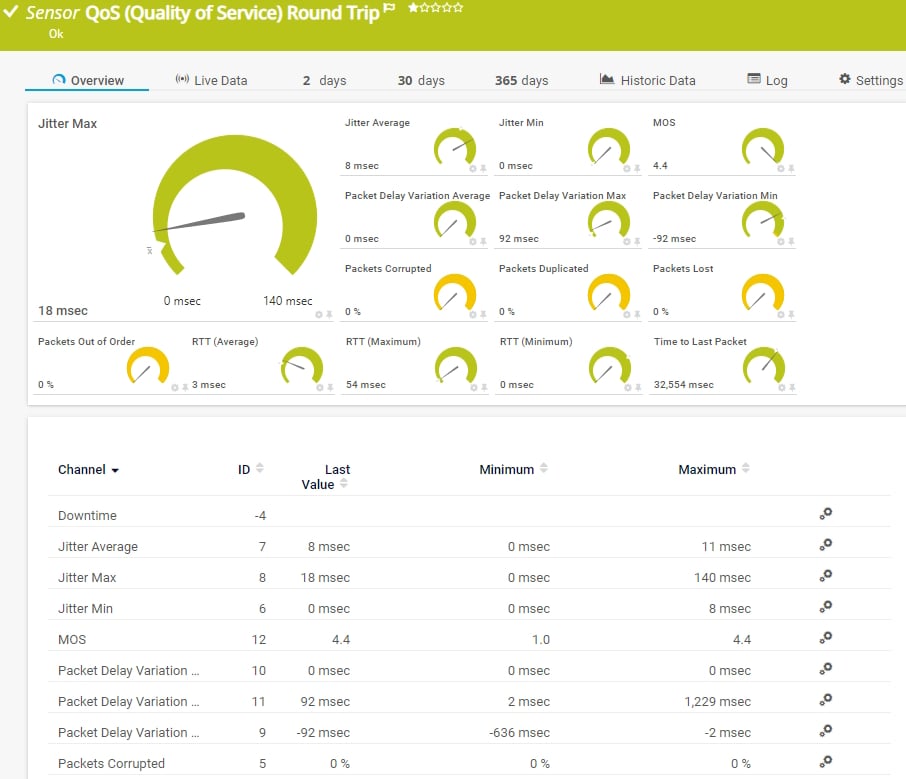
The QoS (Quality of Service) Round Trip sensor monitors parameters regarding the quality of a network connection between two probes. It can show the following:
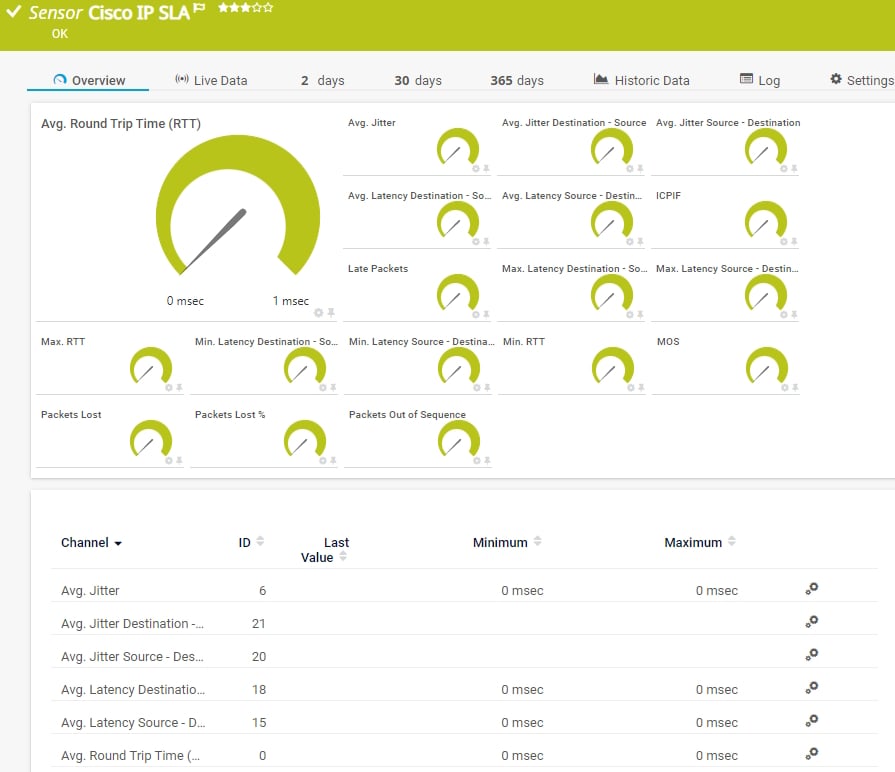
The Cisco IP SLA sensor monitors Voice over IP (VoIP) network parameters using IP service level agreements (SLA) from Cisco. It can show the following:
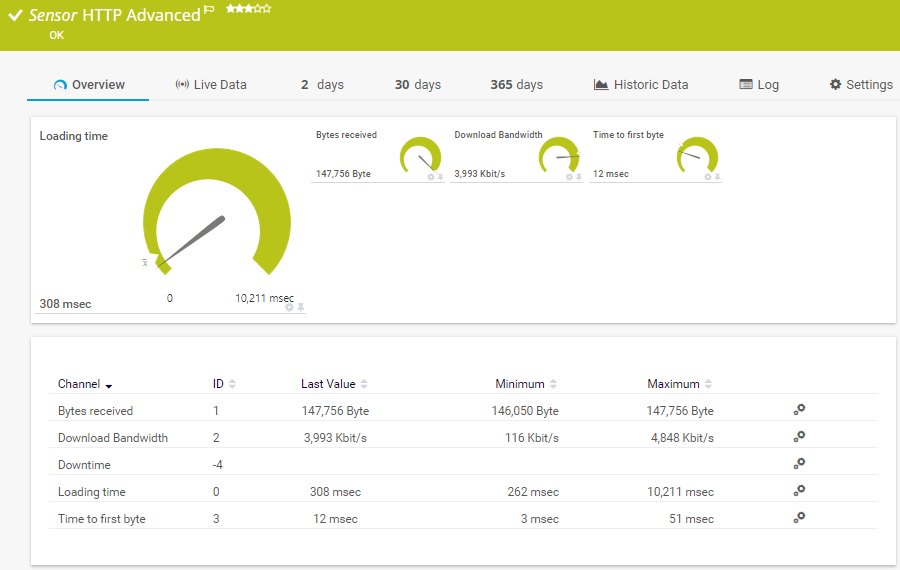
The HTTP Advanced sensor monitors the source code of a web page using HTTP. It supports authentication, content checks, and other advanced parameters. It can show the following:
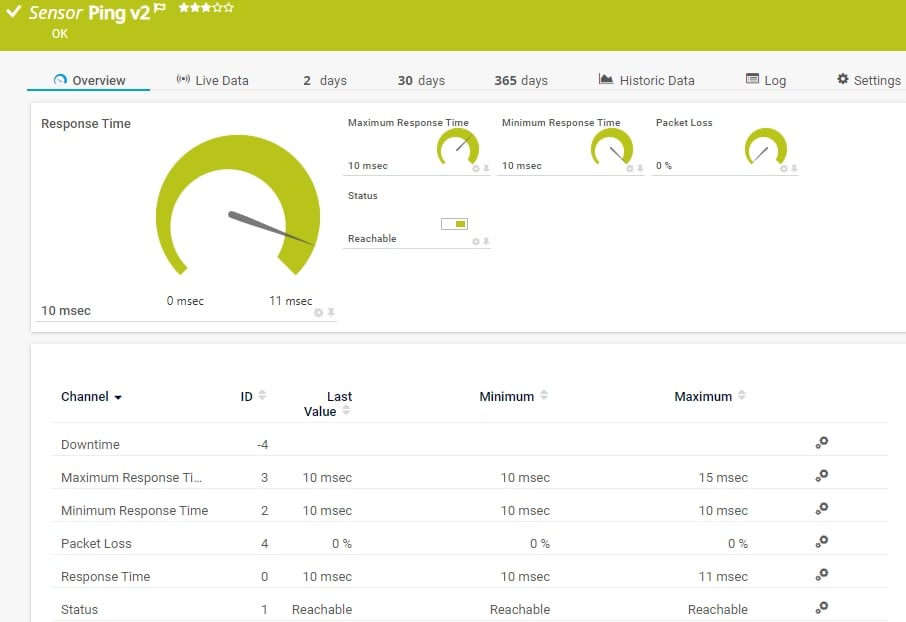
The Ping v2 sensor sends an Internet Control Message Protocol (ICMP) echo request ("ping") from the probe system to the parent device to monitor its availability. It can show the following:
• Response time
• Packet loss
• Target status
• Minimum and maximum ping time
See the PRTG Manual for a list of all available sensor types.

Custom alerts and data visualization let you quickly identify and prevent packet loss and network instability issues..
PRTG is set up in a matter of minutes and can be used on a wide variety of mobile devices.

Partnering with innovative IT vendors, Paessler unleashes synergies to create
new and additional benefits for joined customers.

baramundi and PRTG create a secure, reliable and powerful IT infrastructure where you have everything under control - from the traffic in your firewall to the configuration of your clients.

With ScriptRunner Paessler integrates a powerful event automation platform into PRTG Network Monitor.

UVexplorer integrates tightly with PRTG to bring fast and accurate network discovery, detailed device inventory, and automatic network mapping to the PRTG platform.
Real-time notifications mean faster troubleshooting so that you can act before more serious issues occur.
Network Monitoring Software – Version 24.4.102.1351 (November 12th, 2024)
Download for Windows and cloud-based version PRTG Hosted Monitor available
English, German, Spanish, French, Portuguese, Dutch, Russian, Japanese, and Simplified Chinese
Network devices, bandwidth, servers, applications, virtual environments, remote systems, IoT, and more
Choose the PRTG Network Monitor subscription that's best for you


Packet loss occurs in networks when data packets are lost during transmission or individual data packets arrive late at their destination. Before being sent, data is packaged into several layers. These packets travel through a variety of different hubs (copper cables, fiber optics, wireless, etc.) to reach their destination. In these hubs, TCP or UDP packets get lost or become delayed. Once sent, each packet is marked with a timestamp.
This value specifies the amount of time the sender must wait before obtaining a confirmation of receipt. If a packet gets lost or is delayed, it eventually “times out.” When this happens, a new packet is sent in its place. This is known as a retransmission timeout (RTO).
The result? It leaves gaps in the information your network needs to do its job, resulting in latency and underperformance.
Packet loss can occur at any point in your network: in cables, routers, switches, and other hardware, especially if it's older or missing important updates, in your Citrix environment, SAP applications, or other cloud-based applications, and in your VoIP or video-conferencing system.
But you might not notice, especially if your colleagues don't report the issue. Regular packet loss tests track your network's performance and let you know the second there's a problem so you can take action, also in the case of wireless packet loss.
A packet loss tester is a tool or software used to measure the rate at which data packets are lost or dropped while being transmitted across a network. These tools are crucial in evaluating the reliability and performance of a network connection.
Packet loss testers typically work by sending a series of test packets through a network and then analyzing the number of packets that successfully reach their destination compared to the total number sent. This analysis helps determine the percentage of packet loss occurring in the network.
These tools provide insights into network performance, allowing administrators to identify and troubleshoot issues that could be causing packet loss. They are valuable for maintaining and optimizing network efficiency, especially in situations where reliable and consistent data transmission is essential.
In PRTG, “sensors” are the basic monitoring elements. One sensor usually monitors one measured value in your network, for example the traffic of a switch port, the CPU load of a server, or the free space on a disk drive. On average, you need about 5-10 sensors per device or one sensor per switch port.
Paessler conducted trials in over 600 IT departments worldwide to tune its network monitoring software closer to the needs of sysadmins. The result of the survey: over 95% of the participants would recommend PRTG – or already have.

Paessler PRTG is used by companies of all sizes. Sysadmins love PRTG because it makes their job a whole lot easier.
Bandwidth, servers, virtual environments, websites, VoIP services – PRTG keeps an eye on your entire network.
Everyone has different monitoring needs. That’s why we let you try PRTG for free.