![]()
TCP monitoring with PRTG
Maximum network security, minimum effort
- Monitor TCP ports and data packets in real time
- Get automatically alerted in case of issues
- Increase uptime and enhance network performance
Our users give top ratings for monitoring with Paessler PRTG


PRTG TCP monitoring: What you’ll find on this page

Do you have the full picture?
Monitoring traffic in real time can be tricky even on small networks.
But if you have distributed and virtualized traffic too, well… the challenge factor increases exponentially.
How do you set performance benchmarks in a scenario with so many moving parts? And how do you get a clear view of all the interdependencies that might impact your network's stability and performance?
Paessler PRTG solves these problems by gathering TCP data, TCP/IP data, and other critical metrics from across your network in one place, no matter how complex your setup.
Ideal whether you have a small on-premise network or a large infrastructure with data centers in multiple locations, it can monitor unlimited local, remote, and virtual devices, bringing critical system data together in one simple, intuitive interface you can access from anywhere, saving you time, effort, and headaches.
PRTG makes TCP monitoring as easy as it gets
Custom alerts and data visualization let you quickly identify and prevent low availability, high bandwidth use, downtime, and other network performance issues.
Why PRTG is the TCP monitoring tool of choice for savvy sysadmins
Simple setup
Easy to configure, and even easier to set up. Key in your preferred range of IP addresses and the automatic network discovery will detect connected devices and assign the right sensors. Each sensor is preconfigured, so it works out of the box. But you can customize its settings to suit.
Faster troubleshooting
You shouldn’t have to sift through terabytes of data to pinpoint issues. PRTG's monitoring dashboard brings together mission-critical data in one place, showing you what's going on in real time. And built-in automations alert you if there are issues, while you get on with other tasks.
Greater security
Your performance monitoring data (and network) are in safe hands. PRTG uses SSL encryption and other tough network security measures, including access rights management, SQL injection and cross-site scripting attack protection, and automated logout and re-authentication.
All-in-one monitoring
A clear (and complete) picture of your network in one single monitoring environment – not just TCP monitoring, but also SNMP, ICMP, WMI, SSH, and other protocols, hardware, applications... you get the idea. PRTG simplifies your workflow, saves time, and gives you peace of mind.
What TCP monitoring looks like in PRTG
Diagnose network issues by continuously tracking web, email, DNS servers, databases, routers, switches, firewalls, and other hardware and software components. Show connection times, latency, network traffic, and other key metrics in real time. Visualize monitoring data in clear topology maps and dashboards to identify problems more easily. Gain the overview you need to troubleshoot slow or failed connections, packet loss, and other network performance issues.

Device tree view of the complete monitoring setup
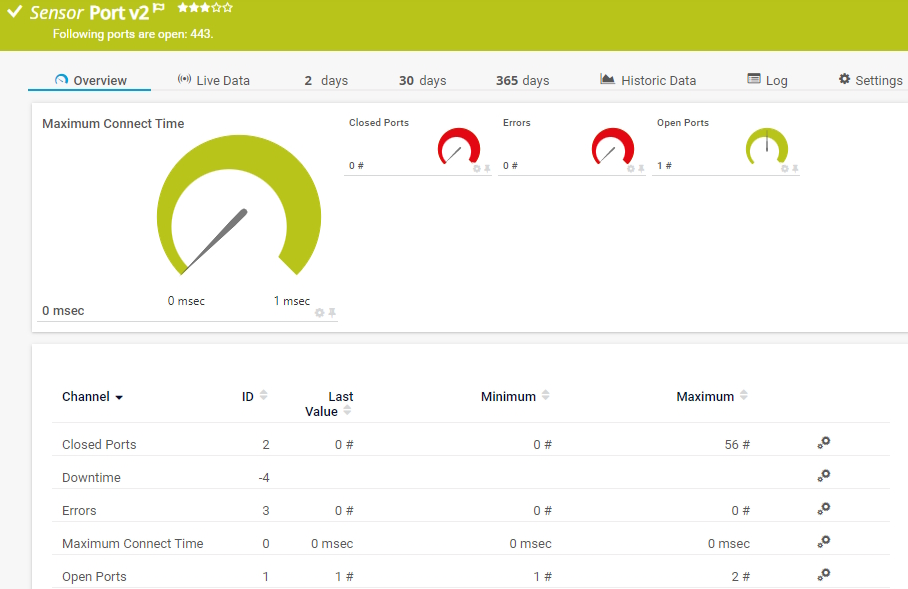
Preconfigured Port v2 sensor in PRTG

Custom PRTG dashboard for keeping an eye on the entire IT infrastructure
Start monitoring TCP ports with PRTG and see how it can make your network more reliable and your job easier.
IT experts agree: Paessler PRTG is a great solution for IT infrastructure monitoring

“All-around winning
network monitor”

“The real beauty of PRTG is the endless possibilities it offers”

“PRTG Network Monitor
is very hard to beat”
Comprehensive TCP monitoring, without the effort
PRTG collects critical data about every device that's connected to your network round the clock, presenting it in easy-to-understand (and completely customizable graphs and dashboards).
That means performance monitoring and pinpointing what's causing an issue are as easy as it gets. PRTG will even alert you automatically if something isn't performing quite as it should.
PRTG's preconfigured TCP monitoring sensors include:
-
Port sensors for monitoring TCP port response times, as well as downtime
- Port v2 sensors for monitoring TCP port status (open or closed), downtime, errors, and response times
- Port Range sensors for monitoring how many TCP ports on your network are closed, the amount of downtime, and how long it takes for each port to accept a request
-
Ping v2 and Cloud Ping v2, for monitoring availability
Your TCP/IP monitor at a glance – even on the go
Set up PRTG in minutes and use it on almost any mobile device.


Find the root cause of the problem with our PRTG TCP monitoring solution
Real-time notifications mean faster troubleshooting so that you can act before more serious issues occur.
PRTG is compatible with all major vendors, products, and systems
![]()
Create innovative solutions with Paessler’s partners
Partnering with innovative vendors, Paessler unleashes synergies to create
new and additional benefits for joined customers.


ScriptRunner
With ScriptRunner, Paessler integrates a powerful event automation platform into PRTG Network Monitor.
“Excellent tool for detailed monitoring. Alarms and notifications work greatly. Equipment addition is straight forward and server initial setup is very easy. ...feel safe to purchase it if you intend to monitor a large networking landscape.”
Infrastructure and Operations Engineer in the Communications Industry, firm size 10B - 30B USD
PRTG makes TCP monitoring as easy as it gets
Custom alerts and data visualization let you quickly identify and prevent low availability, high bandwidth use, downtime, and other network performance issues.

PRTG: The multi-tool for sysadmins
Adapt PRTG individually and dynamically to your needs and rely on a strong API:- HTTP API: Access monitoring data and manipulate monitoring objects via HTTP requests
- Custom sensors: Create your own PRTG sensors for customized monitoring
- Custom notifications: Create your own notifications and send action triggers to external systems
- REST Custom sensor: Monitor almost everything that provides data in XML or JSON format
We asked: would you recommend PRTG?
Over 95% of our customers say yes!
Paessler conducted trials in over 600 IT departments worldwide to tune its network monitoring software closer to the needs of sysadmins.
The result of the survey: over 95% of the participants would recommend PRTG – or already have.

Still not convinced?
![]()
More than 500,000
sysadmins love PRTG
Paessler PRTG is used by companies of all sizes. Sysadmins love PRTG because it makes their job a whole lot easier.
![]()
Monitor your entire IT infrastructure
Bandwidth, servers, virtual environments, websites, VoIP services – PRTG keeps an eye on your entire network.
![]()
Try Paessler PRTG
for free
Everyone has different monitoring needs. That’s why we let you try PRTG for free.
![]()
Start monitoring TCP ports with PRTG and see how it can make your network more reliable and your job easier.
|
PRTG |
Network Monitoring Software - Version 25.1.104.1961 (April 7th, 2025) |
|
Hosting |
Download for Windows and cloud-based version PRTG Hosted Monitor available |
Languages |
English, German, Spanish, French, Portuguese, Dutch, Russian, Japanese, and Simplified Chinese |
Pricing |
Up to 100 sensors for free (Price List) |
Unified Monitoring |
Network devices, bandwidth, servers, applications, virtual environments, remote systems, IoT, and more |
Supported Vendors & Applications |
|
Discover more monitoring insights and stories

Solutions for all your monitoring needs

Powerful stories from the monitoring world

Combining the broad monitoring feature set of PRTG with IP Fabric’s automated network assurance creates a new level of network visibility and reliability.