Paessler PRTG

How-to: Free network monitoring with PRTG

How to use 100 sensors to keep an eye on critical network devices in your IT – at no cost


  • 100 sensors for free for life, all monitoring functionalities included
  • Sufficient for a small company network, large home network, or open-source network
  • Check hardware, applications, network traffic, bandwidth, and more
 

Our users give top ratings for monitoring with Paessler PRTG


PRTG makes free network monitoring as easy as it gets

Custom alerts and data visualization let you quickly identify and prevent all kinds of network issues.


100 sensors for free for life – promise

Paessler PRTG Network Monitor is a professional, easily scalable network monitoring tool for monitoring and troubleshooting your entire enterprise network, no matter if it runs on Windows or Linux operating systems, on-premises or in the cloud.

From hardware and virtualized environments to network traffic, bandwidth usage, and applications, PRTG monitors availability, performance, uptime and downtime, or hardware health metrics such as CPU usage.

The free edition of PRTG includes:

  • 100 sensors, or measuring points, to monitor your network
  • All monitoring functionalities included, also network traffic analysis
  • Real-time alerts and notifications via SMS, email, and other methods
  • Custom maps and dashboards to visualize your network the way you need
  • Customizable reporting based on templates, on-demand or scheduled
  • Unlimited number of remote probes for distributed monitoring


What free network infrastructure monitoring looks like in PRTG

Diagnose network issues by continuously tracking the availability, health, and performance of your entire network. Show hardware health and status, application performance, network traffic, response time, bandwidth usage, and other key metrics in real time. Visualize monitoring data in clear graphs and dashboards to identify problems more easily. Gain the overview you need to troubleshoot all kinds of network issues.
 

Start using free tools for monitoring your network with PRTG and see how it can make your network more reliable and your job easier.


IT experts agree: Paessler PRTG is a great solution for IT infrastructure monitoring

logo

“All-around winning
network monitor”

logo it brief

“The real beauty of PRTG is the endless possibilities it offers”

logo

“PRTG Network Monitor
is very hard to beat”


6 use cases for the PRTG free network monitoring software

Syslog & Trap analyzer

Use PRTG, for example, to receive and analyze syslogs or SNMP trap messages, and let PRTG do the alerting for you based on the content of these messages.

A single Syslog Receiver or SNMP Trap Receiver sensor can theoretically be used to monitor an entire network: Under lab conditions (one single sensor without filters), PRTG can handle 10,000 messages per second, so the software offers more than enough power reserves.

Website monitoring

With 100 sensors, the free version offers enough options for comprehensive website performance monitoring, web server monitoring, or to keep an eye on backup processes.

Use, for example, the HTTP v2 sensor to monitor general availability, the HTTP Full Web Page sensor to measure page load time, or set up a HTTP Transaction sensor to monitor processes like logins or filling out and sending forms. The Cloud HTTP v2 sensor lets you even check website availability and load times worldwide.

Email monitoring

As you might have experienced already, disturbances in email traffic can be quite annoying – and even become business critical. PRTG’s continuous email monitoring alerts you before interruptions occur.

Ensure that sending and receiving emails works well with the preconfigured SMTP & IMAP/POP3 email round trip sensors. Or set up dedicated Microsoft Exchange sensors, for example, to monitor backup jobs, mail queues, mailbox size, email integrity, and other important parameters.

Database monitoring

Databases will be another critical aspect of your network, as the performance of many processes is directly dependent on the performance of the underlying database.

PRTG offers preconfigured SQL sensors (MySQL, Microsoft SQL, ADO SQL, PostgreSQL, and Oracle SQL) for in-depth SQL database monitoring. You can set up the sensors to monitor standard parameters or custom SQL queries, so you can easily tailor your monitoring to fit individual requirements.

Printer monitoring

Printers might not be as integral to you as email or websites, but broken printers, empty toners, or print jams will surely annoy end-users. You will need two sensors per printer: one that monitors the toner levels, print queues etc., and one that checks statistics like the number of printed pages.

With PRTG’s network mapping feature – which involves easy-to-create HTML pages – you can display your printers on a floor plan of the office, so you know immediately where the printer needing maintenance is located.

Traffic analysis

Functions that are usually available only for purchase as add-ons or modules in other monitoring solutions like SolarWinds or ManageEngine, and even in open source tools like Nagios, are included with PRTG.

Maintain a quick overview of top talkers in your network by monitoring and analyzing the traffic on your routers, switches, and firewalls via the flow protocol. PRTG supports NetFlow for Cisco devices, sFlow, jFlow, and IPFIX. And if you don’t want to use flow, no worries: the preconfigured SNMP Traffic v2 sensor has got you covered.


Your free network performance monitor at a glance – even on the go

Set up PRTG in minutes and use it on almost any mobile device.


PRTG comes with all the features you need, plus more your IT infrastructure won't want to live without.


PRTG monitors these vendors and applications in one view!


vendors vm ware


Find the root cause of the problem with our PRTG free network monitoring solution

Real-time notifications mean faster troubleshooting so that you can act before more serious issues occur.


PRTG is compatible with all major vendors, products, and systems


vendors applications blue


Explore our preconfigured PRTG sensors for free network management

PRTG comes with more than 250 native sensor types for monitoring your entire on-premises, cloud, and hybrid cloud environment out of the box. Check out some examples below!


Syslog Receiver

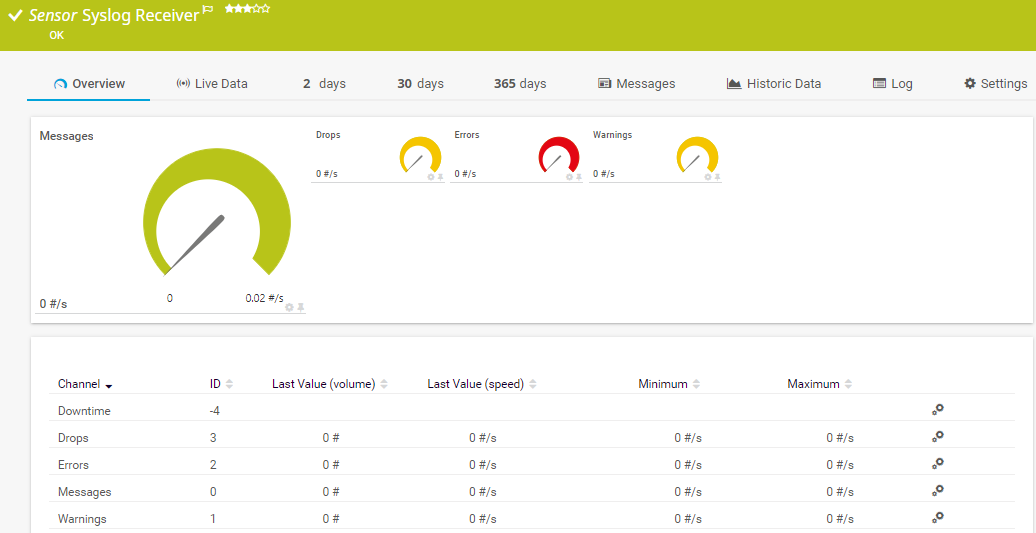
The Syslog Receiver sensor receives and analyzes Syslog messages. It can show the following:

  • Number of dropped packets on the syslog port
  • Number of messages categorized as "error" and “warning”
  • Number of received Syslog messages

HTTP v2

The HTTP v2 sensor monitors a web server. It can show the following:

  • Number of bytes received
  • Web page or element loading time
  • Response code of the target server

HTTP Transaction

The HTTP Transaction sensor monitors an interactive website, such as a web shop, by performing a transaction using a set of HTTP URLs. The sensor monitors whether logins or shopping carts work properly. It can show the following:

  • Maximum amount of data (in kilobytes) that the sensor transfers per request
  • Which user agent string the sensor sends when it connects to the target URL
  • If you want to allow cookies for the transaction
  • What PRTG does with the web page that is loaded at the URL

SMTP&IMAP Round Trip

The SMTP&IMAP Round Trip sensor monitors the time it takes for an email to reach an Internet Message Access Protocol (IMAP) mailbox using the Simple Mail Transfer Protocol (SMTP). It sends an email via the parent device (an SMTP server) and then scans a dedicated IMAP mailbox until the email arrives. It can show the following:

  • Response time of the IMAP server
  • Response time of the SMTP server
  • Sum of the response time of the IMAP server and the SMTP server

Exchange Mailbox (PowerShell)

The Exchange Mailbox (PowerShell) sensor monitors mailboxes of an Exchange server. It can show the following:

  • Number of items
  • Time since the last mailbox login
  • Total size of items

MySQL v2

The MySQL v2 sensor monitors a database on a MySQL server and executes a query. It can show the following:

  • Number of rows addressed by the query
  • Execution time of the entire request
  • Execution time of the specified query

SNMP Printer

The SNMP Printer sensor monitors various types of printers. It can show the following:

  • Cartridges fill levels
  • Printer cover status
  • Total number of printed pages

Windows Print Queue

The Windows Print Queue sensor reads the print queue on the parent device and returns the number of jobs in the print queue. It can monitor queues for all printers that are locally installed. It can show the following:

  • Execution time
  • Number of jobs in the queue

NetFlow v9

The NetFlow v9 sensor receives traffic data from a NetFlow v9-compatible device and shows the traffic by type. This sensor has several filter options to divide traffic into different channels. It can show the following and more:

  • Traffic from Citrix applications
  • Traffic from file transfer (FTP/P2P) and various other protocols (UDP, TCP)
  • Traffic from network services (DHCP, DNS, Ident, ICMP, SNMP)
  • Internet mail traffic (IMAP, POP3, SMTP)
  • Traffic from remote control applications (RDP, SSH, Telnet, Virtual Network Computing (VNC))
 

Create innovative solutions with Paessler’s partners

Partnering with innovative vendors, Paessler unleashes synergies to create
new and additional benefits for joined customers.

Martello

By integrating PRTG with Martello iQ, you can add a fast analytics layer to improve uptime, visualize your IT environment, and integrate all of your IT systems into a single pane of glass.

Read more

Plixer

Paessler and Plixer provide a complete solution adding flow and metadata analysis to a powerful network monitoring tool.

Read more

Siemon

Siemon and Paessler bring together intelligent building technology and advanced monitoring and make your vision of intelligent buildings and data centers become reality.

Read more


gartner-peer-insights-badge-color.svg

“Excellent tool for detailed monitoring. Alarms and notifications work greatly. Equipment addition is straight forward and server initial setup is very easy. ...feel safe to purchase it if you intend to monitor a large networking landscape.”

Infrastructure and Operations Engineer in the Communications Industry, firm size 10B - 30B USD

Read the entire review at Gartner Peer Insights 


PRTG makes free network monitoring as easy as it gets

Custom alerts and data visualization let you quickly identify and prevent all kinds of network issues.


Monitoring networks for free: FAQ


What is PRTG Network Monitor?

Paessler PRTG Network Monitor is a proprietary software tool that monitors the performance and health of every component on your network. The intuitive dashboard shows you which devices, applications, web services, and other aspects of your IT infrastructure are running smoothly, and whether any are underperforming or causing issues.

You can then use a specialized diagnostic tool – many hardware manufacturers (such as HPE or Dell) and operating systems (Windows, macOS, and Linux) for instance, offer such tools out of the box – to get to the root of the problem and fix it.

What’s included in the free edition of PRTG?

With our free network monitoring tool, you get:

  • A freeware monitoring solution for up to 100 sensors for life
  • Monitoring of hardware, software, network performance, data traffic included
  • Free alerting, reporting, ticketing, and network mapping features

With the freeware edition of PRTG, you can get started with network monitoring in a matter of minutes. Our auto-discovery function detects all network devices within a given IP address range and automatically incorporates them into your monitoring environment.

What is the price of the paid version of PRTG? What does it include?

PRTG’s flexible subscription licensing makes it easy to scale up or down as needed. You pay only for the number of sensors you need. After your 30-day free trial of the unlimited version of PRTG, you can still use the free version with 100 free sensors, or choose a commercial license. Review our pricing

Can you give me some network analysis tips?

Network analysis involves examining relationships and connections among various elements within a system. Here are some tips to get you started:

  • Define your objectives: Clearly outline what you aim to achieve through network analysis. Whether it's understanding relationships, identifying key players, or measuring the flow of information, having a clear goal will guide your analysis.
  • Data preparation: Ensure your data is formatted properly. Nodes (individual entities) and edges (connections between nodes) should be clearly defined. Data cleaning and transformation might be necessary to standardize information.
  • Network visualization: Visual representation is powerful for understanding network structures. Experiment with different layouts, colors, and node sizing to highlight important elements or patterns within the network.
  • Dynamic network analysis: If applicable, consider the temporal aspect of networks. Analyze how connections change over time to gain insights into evolving relationships.
  • Iterate and refine: Network analysis often involves an iterative process. Refine your approach based on initial findings and feedback, adjusting parameters or exploring different analytical methods as needed.

What is a sensor in PRTG?

In PRTG, “sensors” are the basic monitoring elements. One sensor usually monitors one measured value in your network, for example the traffic of a switch port, the CPU load of a server, or the free space on a disk drive.

On average, you need about 5-10 sensors per device or one sensor per switch port.


PRTG the multi-tool

PRTG: The multi-tool for sysadmins

Adapt PRTG individually and dynamically to your needs and rely on a strong API:

  • HTTP API: Access monitoring data and manipulate monitoring objects via HTTP requests
  • Custom sensors: Create your own PRTG sensors for customized monitoring
  • Custom notifications: Create your own notifications and send action triggers to external systems
  • REST Custom sensor: Monitor almost everything that provides data in XML or JSON format


We asked: would you recommend PRTG?
Over 95% of our customers say yes!


Paessler conducted trials in over 600 IT departments worldwide to tune its network monitoring software closer to the needs of sysadmins.
The result of the survey: over 95% of the participants would recommend PRTG – or already have.


Recommend PRTG


Still not convinced?

love

More than 500,000
sysadmins love PRTG

Paessler PRTG is used by companies of all sizes. Sysadmins love PRTG because it makes their job a whole lot easier.

speed

Monitor your entire IT infrastructure

Bandwidth, servers, virtual environments, websites, VoIP services – PRTG keeps an eye on your entire network.

trial

Try Paessler PRTG
for free

Everyone has different monitoring needs. That’s why we let you try PRTG for free.


Paessler PRTG 

Start using free tools for monitoring your network with PRTG and see how it can make your network more reliable and your job easier.


PRTG

Network Monitoring Software - Version 24.4.102.1351 (November 12th, 2024)

Hosting

Download for Windows and cloud-based version PRTG Hosted Monitor available

Languages

English, German, Spanish, French, Portuguese, Dutch, Russian, Japanese, and Simplified Chinese

Pricing

Up to 100 sensors for free (Price List)

Unified Monitoring

Network devices, bandwidth, servers, applications, virtual environments, remote systems, IoT, and more

Supported Vendors & Applications

More
cisco logo grey 40 dell logo grey 40 hp logo grey 40 ibm grey40 netapp grey40 linux grey40 aws grey40 windows grey40 vmware grey40 citrix grey40 exchange grey40 apache grey40 oracle grey40