Custom alerts and data visualizations let you quickly identify and prevent bottlenecks and other network performance issues.
They need regular monitoring and maintenance (and some occasional pruning) to keep working as they should.
One sluggish application or faulty bit of hardware can disrupt your whole organization. Cue the complaints from your colleagues (or, worse, an angry call from your boss).
Paessler PRTG's comprehensive, all-in-one network monitoring tool gathers critical data in one place, making it easy to keep track of overall network performance and optimize the allocation of network resources.
More than that, it enables you to plan ahead, alerting you to potential issues before something happens so you can take steps to ensure your network keeps meeting your organization's needs.

Put some clear and concise content in here. Keep your reader in mind. What are they trying to do? What are they hoping to learn? Why are they reading this? Help them out and use the tone and voice of your organization.
Diagnose network issues by continuously tracking servers, routers, switches, virtual machines, firewalls, and other network hardware and components. Show uptime, data packet loss, jitter, network latency, data transfer speeds, response times, VoIP and QoS values, and other key metrics in real time. Visualize monitoring data in clear graphs and dashboards to identify problems more easily. Gain the overview you need to troubleshoot and optimize network congestion and other inefficiencies in your network infrastructure.

Live traffic data graph in PRTG

Device tree view of the complete monitoring setup

Custom PRTG dashboard for keeping an eye on the entire IT infrastructure
Live traffic data graph in PRTG
Device tree view of the complete monitoring setup
“All-around winning
network monitor”
“The real beauty of PRTG is the endless possibilities it offers”
“PRTG Network Monitor
is very hard to beat”
PRTG's comprehensive monitoring capabilities help you ensure your network maintains its performance both in the short, medium, and long term.
If your coworkers are continually complaining about slow applications and your network seems to always be down, then it’s time to get to the root of the problem.
PRTG monitors all the fundamental data in your network. It quickly shows you which applications are hogging bandwidth or where bottlenecks are hiding. Hardware malfunctions can also contribute to a sluggish network. PRTG promptly informs you if your hardware is overloaded or no longer available.
Once you have uncovered possible weak spots in your network, it’s way easier to go about upgrading or reconfiguring your IT infrastructure.
You might be in need of additional web servers, bigger hard disks, or simply new workstations for your coworkers. PRTG’s historical data makes a strong case when it comes to convincing your higher-ups. What’s more, PRTG will show you exactly how to save precious resources.
PRTG comes with more than 250 native sensor types for monitoring your entire on-premises, cloud, and hybrid cloud environment out of the box. Check out some examples below!
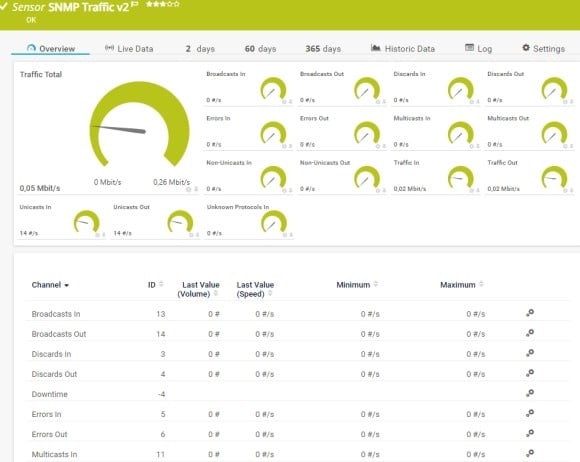
The SNMP Traffic v2 sensor monitors bandwidth and traffic on a device. It can show the following:
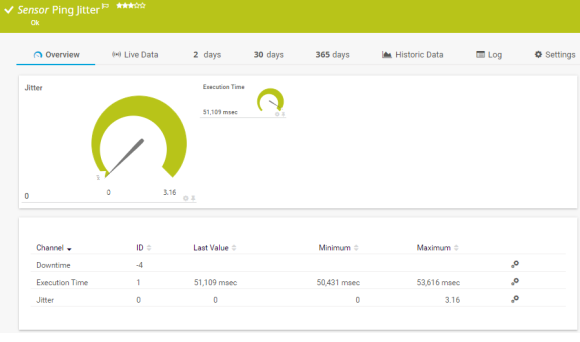
The Ping Jitter sensor sends a series of Internet Control Message Protocol (ICMP) echo requests ("pings") to a URI to determine the statistical jitter. It can show the following:
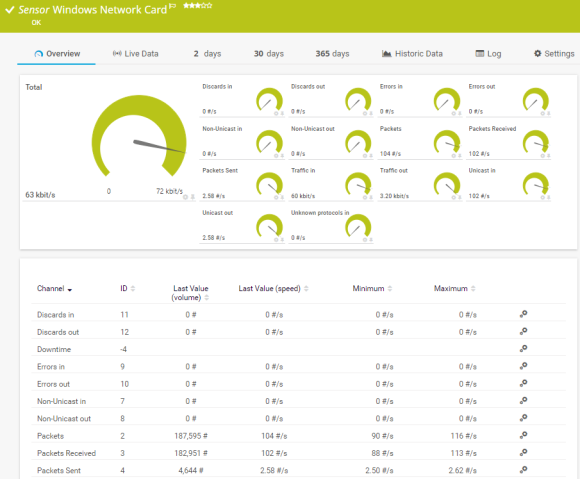
The Windows Network Card sensor monitors the bandwidth usage and traffic of a network interface via Windows Management Instrumentation (WMI) or Windows performance counters. It can show the following:
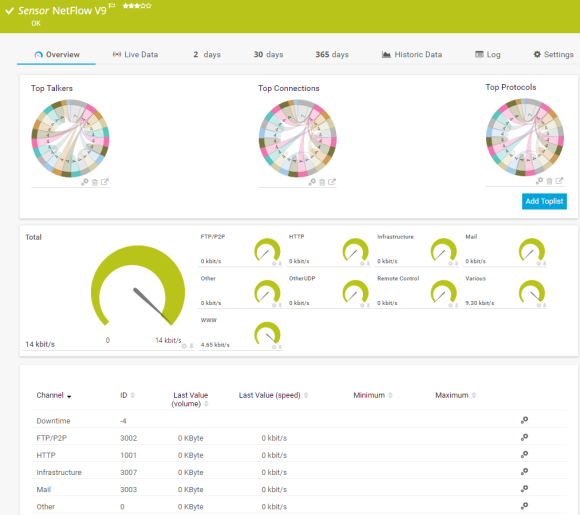
The NetFlow v9 sensor receives traffic data from a NetFlow v9-compatible device and shows the traffic by type. This sensor has several filter options to divide traffic into different channels. It can show the following and more:
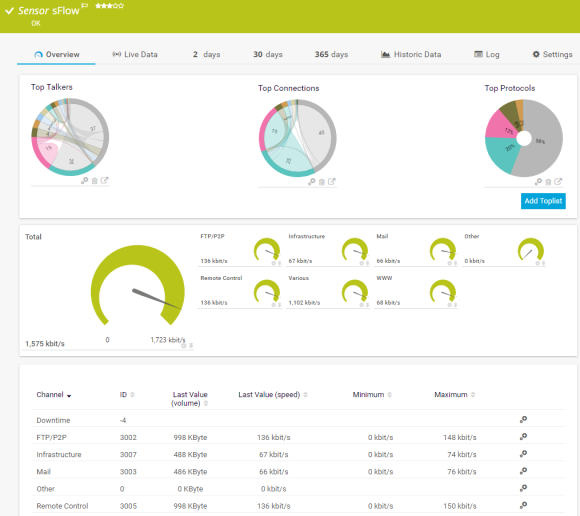
The sFlow sensor receives traffic data from an sFlow v5-compatible device and shows the traffic by type. This sensor has several filter options to divide traffic into different channels. It can show the following and more:
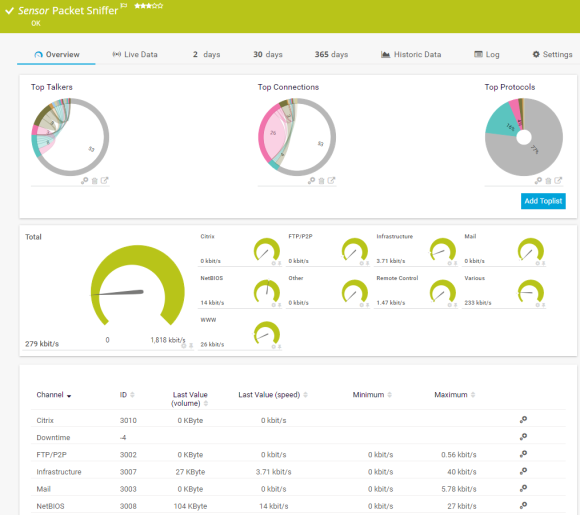
The Packet Sniffer sensor monitors the headers of data packets that pass a local network card using a built-in packet sniffer. You can choose from predefined channels. It can show the following and more:
See the PRTG Manual for a list of all available sensor types.

Real-time notifications mean faster troubleshooting so that you can act before more serious issues occur.
PRTG is set up in a matter of minutes and can be used on a wide variety of mobile devices.


“Excellent tool for detailed monitoring. Alarms and notifications work greatly. Equipment addition is straight forward and server initial setup is very easy. ...feel safe to purchase it if you intend to monitor a large networking landscape.”
Partnering with innovative IT vendors, Paessler unleashes synergies to create
new and additional benefits for joined customers.

By integrating PRTG with Martello iQ, you can add a fast analytics layer to improve uptime, visualize your IT environment, and integrate all of your IT systems into a single pane of glass.
Integrating monitoring results from PRTG into NetBrain maps makes the foundation for network automation.

Siemon and Paessler bring together intelligent building technology and advanced monitoring and make your vision of intelligent buildings and data centers become reality.
Custom alerts and data visualizations let you quickly identify and prevent bottlenecks and other network performance issues.
Network Monitoring Software – Version 24.4.102.1351 (November 12th, 2024)
Download for Windows and cloud-based version PRTG Hosted Monitor available
English, German, Spanish, French, Portuguese, Dutch, Russian, Japanese, and Simplified Chinese
Network devices, bandwidth, servers, applications, virtual environments, remote systems, IoT, and more
Choose the PRTG Network Monitor subscription that's best for you


Network optimization is the process of enhancing the efficiency and performance of a computer network. It involves improving various aspects such as bandwidth utilization, latency, throughput, and overall network reliability. Techniques used in network optimization include traffic shaping, load balancing, and the deployment of advanced routing algorithms. The goal is to ensure optimal data flow and connectivity, minimizing delays and maximizing resource use.
Optimizing your network is crucial for several reasons:
PRTG is a proprietary software tool that tracks the health and performance of every component that forms part of your network. Available for Windows-based on-premises servers or as a cloud-hosted solution, it's capable of monitoring unlimited local, remote, and virtual network devices, bringing critical system data together in one simple, intuitive interface you can access from anywhere: at the office, at home, or on the go. Better still, PRTG enables you to pinpoint weak spots in your network and work out the steps you should take to maintain optimum performance.
Because it gives you a complete view of your network's performance. PRTG's easy-to-understand dashboards show you exactly what steps you need to take to free up more resources. More to the point, PRTG's data allows you to be proactive, upgrading your infrastructure and replacing components that are past their prime before they let you (and your organization) down.
In PRTG, “sensors” are the basic monitoring elements. One sensor usually monitors one measured value in your network, for example the traffic of a switch port, the CPU load of a server, or the free space on a disk drive. On average, you need about 5-10 sensors per device or one sensor per switch port.
Paessler conducted trials in over 600 IT departments worldwide to tune its network monitoring software closer to the needs of sysadmins. The result of the survey: over 95% of the participants would recommend PRTG – or already have.

Paessler PRTG is used by companies of all sizes. Sysadmins love PRTG because it makes their job a whole lot easier.
Bandwidth, servers, virtual environments, websites, VoIP services – PRTG keeps an eye on your entire network.
Everyone has different monitoring needs. That’s why we let you try PRTG for free.