Custom alerts and data visualization let you quickly identify and prevent network performance bottlenecks.
Network management is full of constant, often unpredictable network problems that pop up randomly, as any system admin knows. They all need immediate attention, whether it’s a network security issue, bad actors in the system, or a downed network device. Paessler PRTG takes the “frantic” out of network administration with comprehensive, customizable network monitoring.
Diagnose network issues by continuously tracking network activity and traffic. Show bandwidth usage, uptime, response time, latency, packet loss, and other key metrics in real time. Visualize monitoring data in clear graphs and dashboards to identify problems more easily. Gain the overview you need to troubleshoot network inefficiencies.

Live traffic data graph in PRTG

Device tree view of the complete monitoring setup

Custom PRTG dashboard for keeping an eye on the entire IT infrastructure
Live traffic data graph in PRTG
Device tree view of the complete monitoring setup
“All-around winning
network monitor”
“The real beauty of PRTG is the endless possibilities it offers”
“PRTG Network Monitor
is very hard to beat”
We hear you, which is why PRTG doesn’t just monitor your network; it helps you optimize it. PRTG provides detailed insights in a single, customizable dashboard.
This information, coupled with real-time alerts (also customizable), helps you make proactive, informed decisions about network upgrades and resource allocation, as well as other actions.
Quality of Service (QoS) is critical if you want to make sure you maintain high performance and reliability for your sensitive applications.
PRTG helps you monitor and measure your QoS metrics, so important applications get the bandwidth and resources they need.
You don’t have to switch out your monitoring tool every time your organization grows. Thankfully, PRTG is designed to growth with your network, so it’s suitable for networks of any size.
Its flexible licensing options and ability to monitor thousands of devices means it can scale for both small and large businesses.
We worked hard to make sure you don’t have to. PRTG has an intuitive interface that makes it easy for both novice and experienced IT professionals to use. (This is what our clients say...)
You can tailor the dashboard to show you the views you need, so you’re more productive and less frustrated while you keep your network running smoothly.
PRTG comes with more than 250 native sensor types for monitoring your entire on-premises, cloud, and hybrid cloud environment out of the box. Check out some examples below!
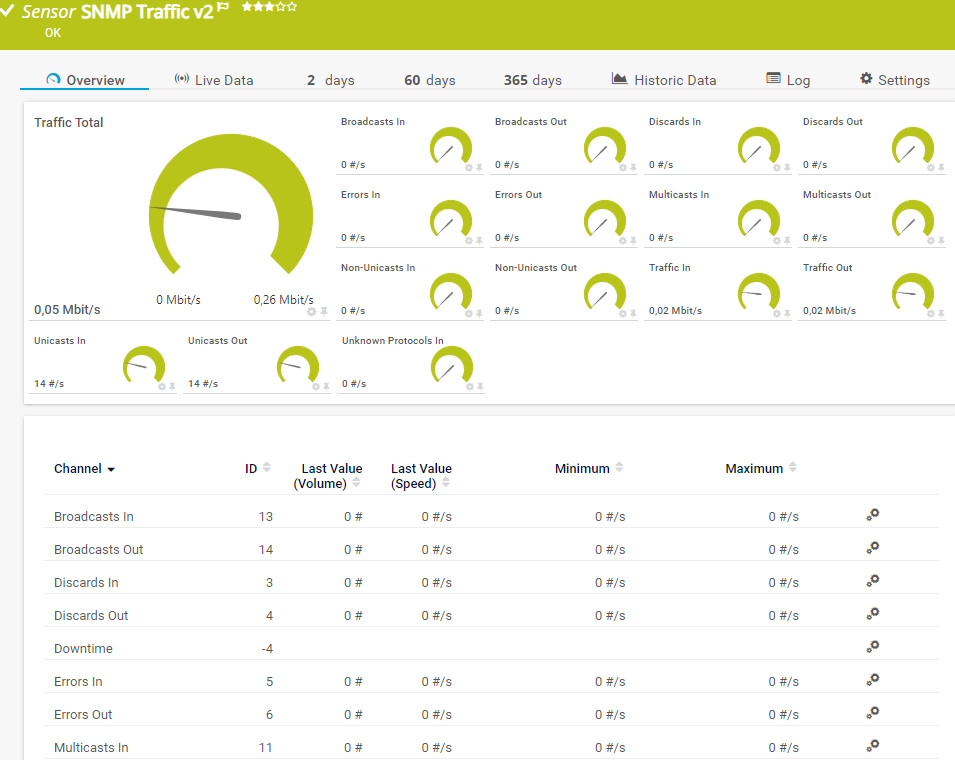
The SNMP Traffic v2 sensor monitors bandwidth and traffic on a device. It can show the following:
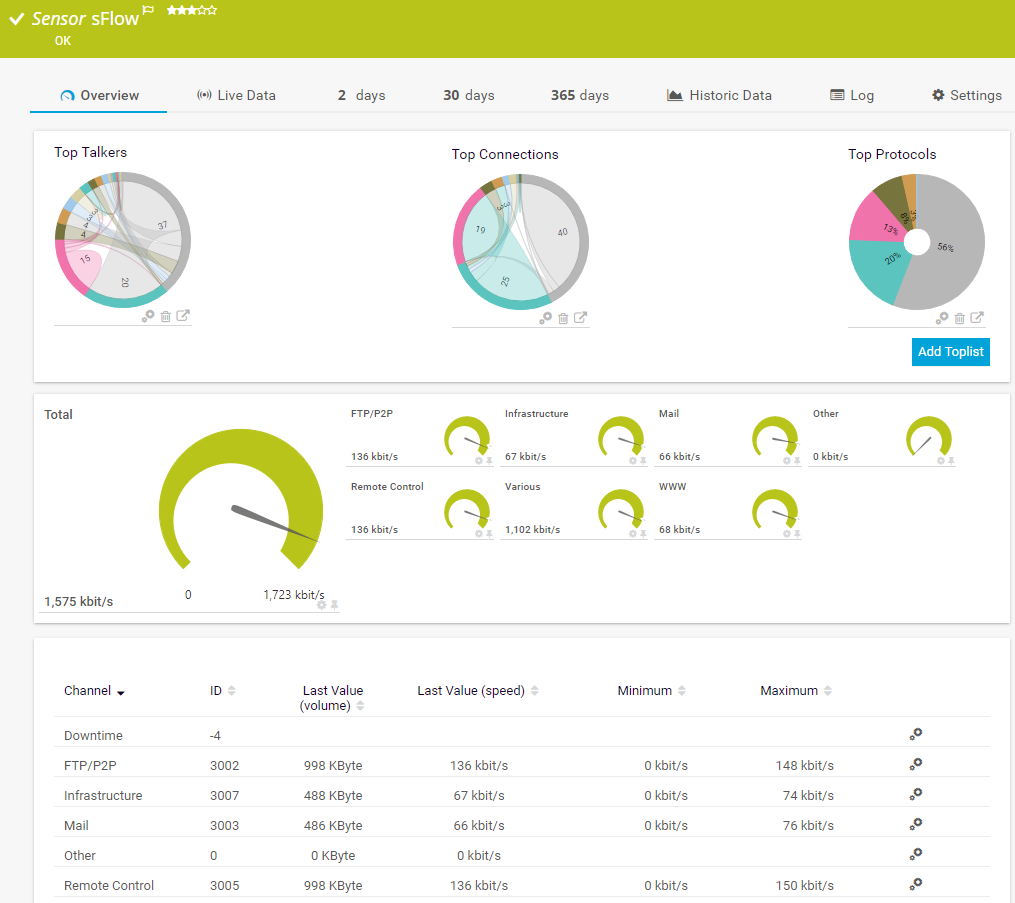
The sFlow sensor receives traffic data from an sFlow v5-compatible device and shows the traffic by type. This sensor has several filter options to divide traffic into different channels. It can show the following and more:
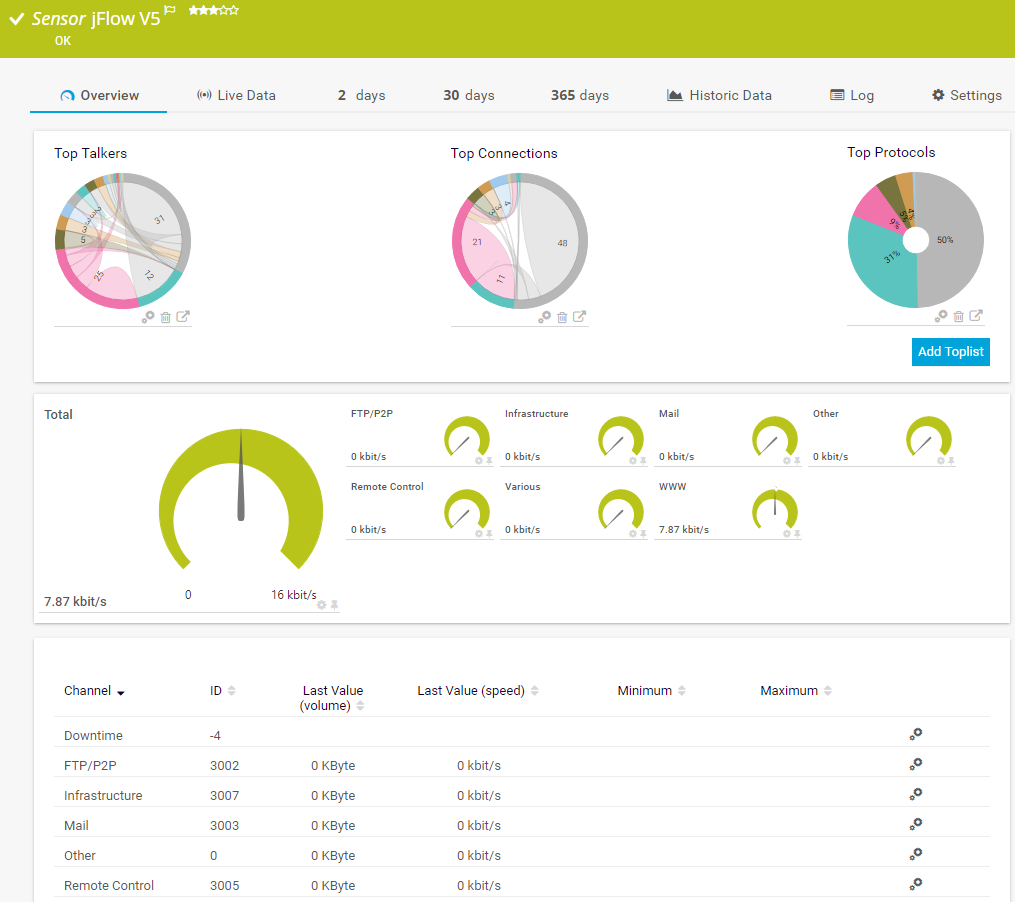
The jFlow v5 sensor receives traffic data from a jFlow v5-compatible device and shows the traffic by type. It can show the following and more:
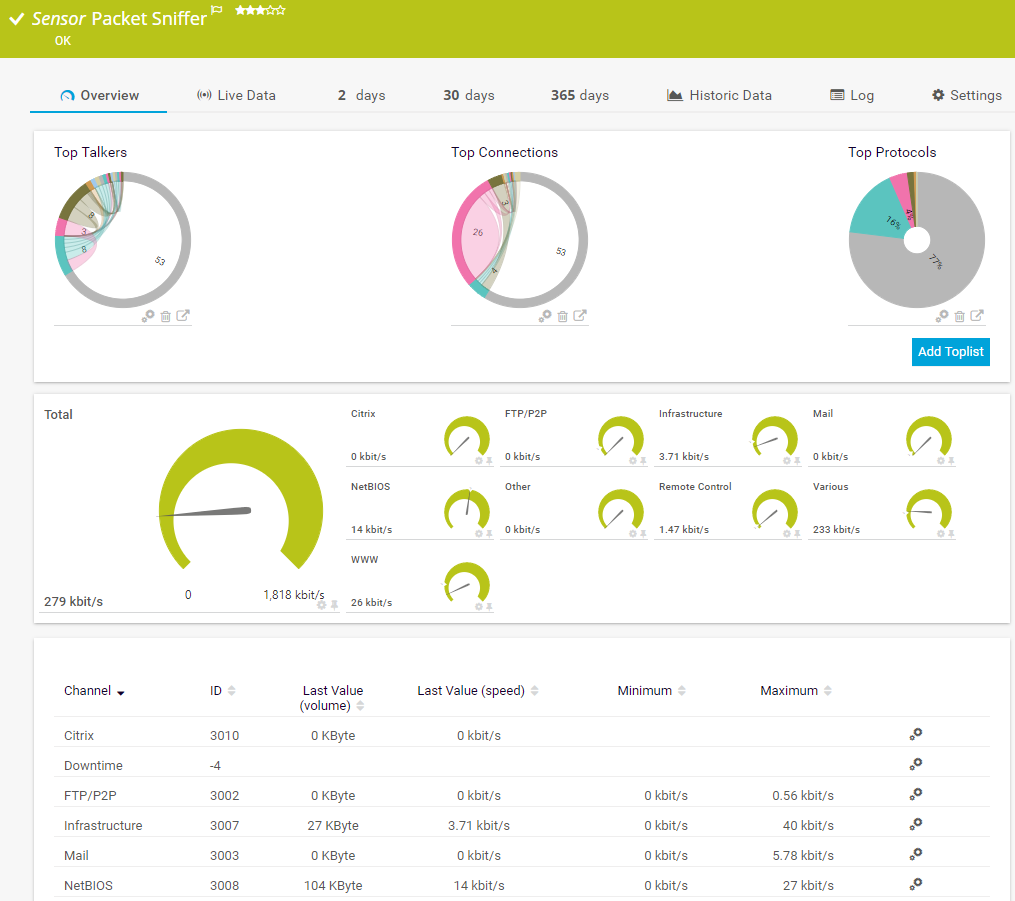
The Packet Sniffer sensor monitors the headers of data packets that pass a local network card using a built-in packet sniffer. You can choose from predefined channels. It can show the following and more:
See the PRTG Manual for a list of all available sensor types.

Real-time notifications mean faster troubleshooting so that you can act before more serious issues occur.
Set up PRTG in minutes and use it on almost any mobile device.


“Excellent tool for detailed monitoring. Alarms and notifications work greatly. Equipment addition is straight forward and server initial setup is very easy. ...feel safe to purchase it if you intend to monitor a large networking landscape.”
Partnering with innovative IT vendors, Paessler unleashes synergies to create
new and additional benefits for joined customers.

Combining PRTG’s broad monitoring feature set with IP Fabric’s automated network assurance creates a new level of network visibility and reliability.

Paessler and Plixer provide a complete solution adding flow and metadata analysis to a powerful network monitoring tool.

UVexplorer integrates tightly with PRTG to bring fast and accurate network discovery, detailed device inventory, and automatic network mapping to the PRTG platform.
Custom alerts and data visualization let you quickly identify and prevent network performance bottlenecks.
Network Monitoring Software – Version 24.4.102.1351 (November 12th, 2024)
Download for Windows and cloud-based version PRTG Hosted Monitor available
English, German, Spanish, French, Portuguese, Dutch, Russian, Japanese, and Simplified Chinese
Network devices, bandwidth, servers, applications, virtual environments, remote systems, IoT, and more
Choose the PRTG Network Monitor subscription that's best for you


Network utilization is the proportion of the current network traffic to the maximum amount of traffic that can be handled. It indicates the bandwidth consumption in the network. While high network traffic means that the network is overloaded, low network traffic means that the network is not busy. If the network load reaches or exceeds the threshold under normal conditions, this will result in low network speed, interruptions, timeouts, etc. The network load is an indicator of the network utilization.
Your network utilization rate is the percentage of total bandwidth being used at any given time. This metric indicates how efficient your network is. high usage rates can signal that the network is nearing capacity, while low rates might suggest your resources are underused.
Yes, indeed! Network utilization monitoring gives you a baseline of what a normal traffic pattern looks like for your organization. Any deviation – a spike in bandwidth usage, unusual traffic patterns, unexpected data flows – can indicate a potential security threat. PRTG can also detect unauthorized access and port scanning, as well as monitor data transfer volumes.
There are several key metrics. They include bandwidth usage, which measures how much data is being sent over the network. Metrics also include throughput, latency, packet loss, and error rates. By watching these metrics, you can correctly identify potential issues before they become major problems and affect user experience.
When network use isn’t optimized, several areas can suffer. WAN links, for example, are a common place for bottlenecks. End-user devices, VoIP systems, and even routers and switches that handle high traffic volumes are all possible areas affected by poor bandwidth allocation.
In PRTG, “sensors” are the basic monitoring elements. One sensor usually monitors one measured value in your network, for example the traffic of a switch port, the CPU load of a server, or the free space on a disk drive. On average, you need about 5-10 sensors per device or one sensor per switch port.
Paessler conducted trials in over 600 IT departments worldwide to tune its network monitoring software closer to the needs of sysadmins. The result of the survey: over 95% of the participants would recommend PRTG – or already have.

Paessler PRTG is used by companies of all sizes. Sysadmins love PRTG because it makes their job a whole lot easier.
Bandwidth, servers, virtual environments, websites, VoIP services – PRTG keeps an eye on your entire network.
Everyone has different monitoring needs. That’s why we let you try PRTG for free.