Custom alerts and data visualization let you quickly identify and prevent performance issues.
The Internet of Things (IoT) is everywhere – and more than likely in your own network too. That means you need to monitor IoT devices. With dedicated and custom IoT sensors, Paessler PRTG gives you all the benefits of IoT monitoring.
The Internet of Things (IoT) is everywhere – and more than likely in your own network too. That means you need to monitor IoT devices. With dedicated and custom IoT sensors, Paessler PRTG gives you all the benefits of IoT monitoring.
PRTG monitors the connectivity, latency and device health of connected devices in real-time using ping, SNMP, HTTP and more. When devices fail, PRTG alerts you right away with notifications, helping you quickly troubleshoot and get to the root cause of IoT problems.
Many IoT devices come with their own proprietary monitoring tools. However, what you don’t need is multiple monitoring tools. PRTG lets you consolidate your IoT monitoringv – and infrastructure monitoring – in one comprehensive monitoring solution.
Visualize your IoT ecosystem with comprehensive and fully customizable dashboards in PRTG. Display granular data about the status of a specific IoT device, or aggregate data to show a high-level overview of your entire IoT ecosystem: display the data in whichever way you need it.
Diagnose network issues by continuously tracking IoT devices. Show connectivity, IoT device health and other key metrics in real time. Visualize monitoring data in clear graphs and dashboards to identify problems more easily. Gain the overview you need to troubleshoot IoT device problems.

Device tree view of the complete monitoring setup

Custom PRTG dashboard for keeping an eye on the entire IT infrastructure

Live traffic data graph in PRTG
“All-around winning
network monitor”
“The real beauty of PRTG is the endless possibilities it offers”
“PRTG Network Monitor
is very hard to beat”
A high temperature in a data center can cause servers and other hardware to overheat and malfunction. IoT thermometers can be installed in the data center, and PRTG can be used to retrieve real-time data from these devices. If the temperature exceeds a specific threshold, PRTG will send alerts directly to the responsible IT teams.
MQTT is a lightweight protocol widely used as an IoT platform for communication between IoT devices and a central hub (the MQTT broker). PRTG offers specialized MQTT sensors to monitor the health of this environment, ensuring messages are sent and received correctly. PRTG monitors device connectivity, message delivery, and broker availability.
The use cases for IoT monitoring with PRTG extend beyond traditional IT. A good example is industrial manufacturing: Industrial Internet of Things (IIoT) devices are used to monitor the health and performance of machines and equipment, such as motor rotations or machine vibration. This information can also be brought into PRTG for monitoring and alerting.
PRTG comes with more than 250 native sensor types for monitoring your entire on-premises, cloud, and hybrid cloud environment out of the box. Check out some examples below!
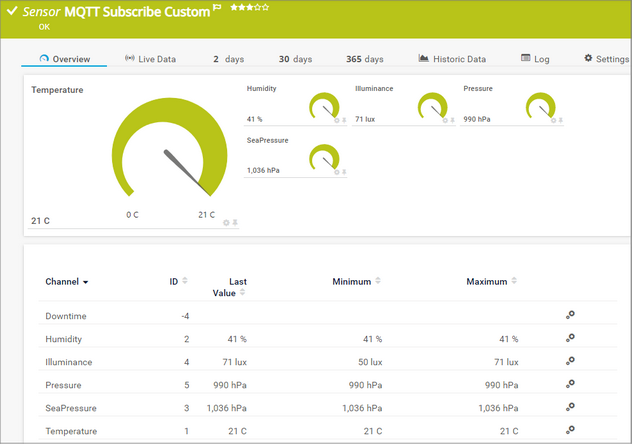
The MQTT Subscribe Custom sensor subscribes to a Message Queue Telemetry Transport (MQTT) topic and monitors up to ten numeric values from the received JSON data. It can show the following:
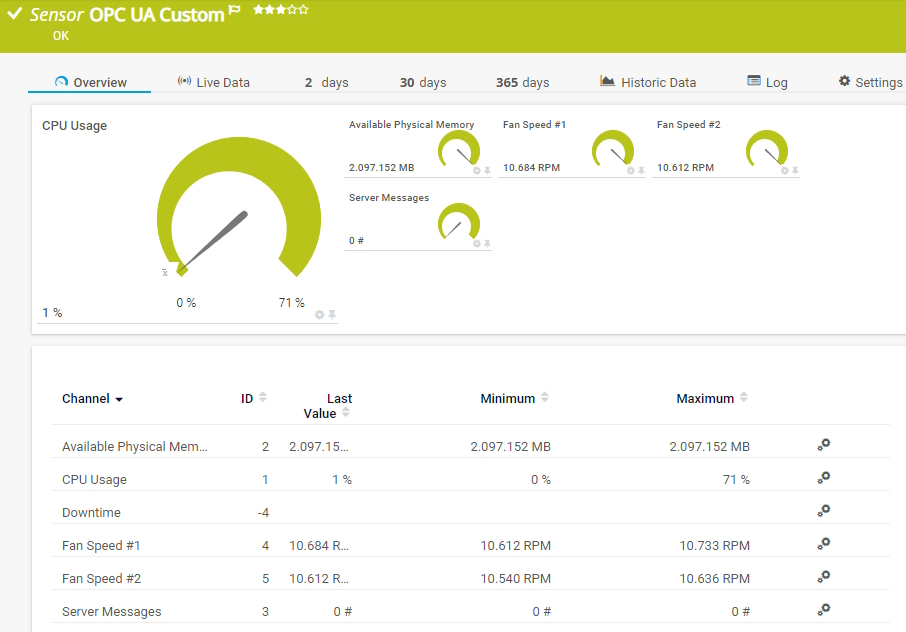
The OPC UA Custom sensor monitors up to ten numeric values returned by specific OPC Unified Architecture (OPC UA) NodeIDs. It can show the following:
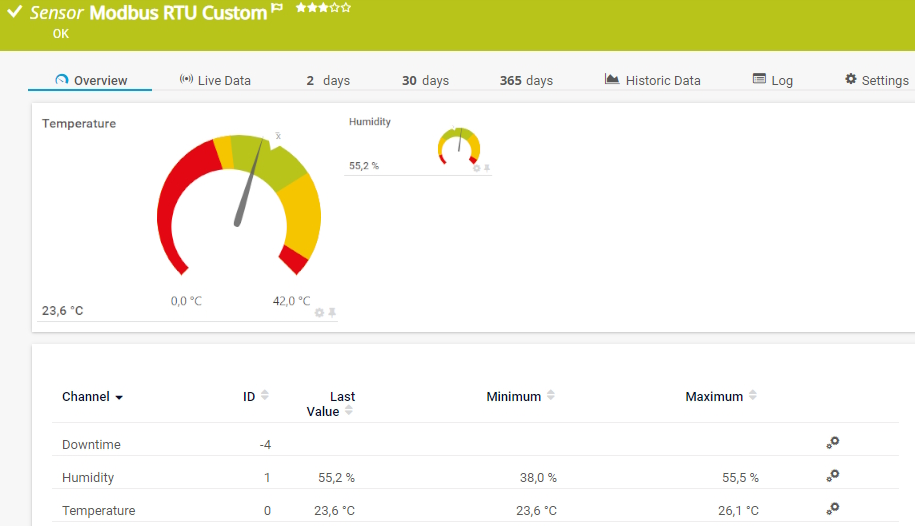
The Modbus RTU Custom sensor connects to a Modbus Remote Terminal Unit (RTU) server and monitors up to ten returned numeric values. It can show the following:
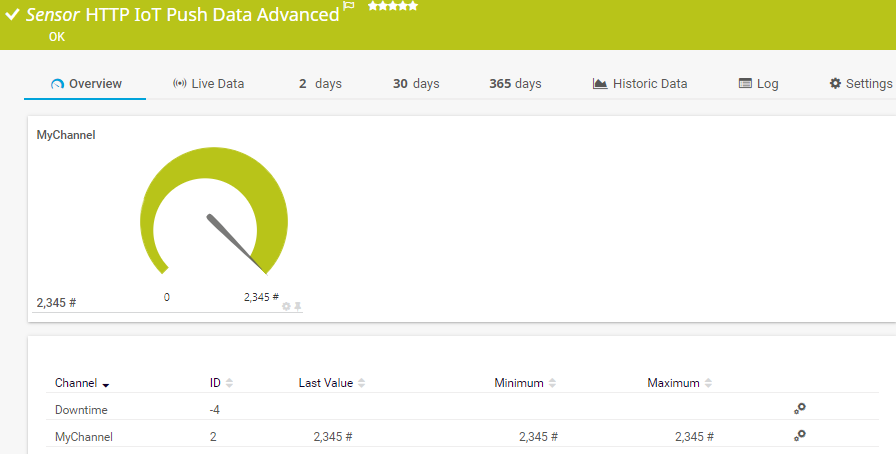
The HTTP IoT Push Data Advanced sensor displays data from messages that are received from Internet of Things (IoT) capable devices and that are pushed via an HTTPS request to PRTG. It can show the following:
See the PRTG Manual for a list of all available sensor types.

Custom alerts and data visualization let you quickly identify and prevent performance issues.
PRTG is set up in a matter of minutes and can be used on a wide variety of mobile devices.

Partnering with innovative IT vendors, Paessler unleashes synergies to create
new and additional benefits for joined customers.
Paessler is member of the mioty alliance, composed of companies that use mioty to create innovative IoT and IIoT solutions such as the retrofitting of industrial environments.
Combine the functionality of Sigfox and Paessler for the most comprehensive, cost-effective, and easy-to-use IoT solution available.
Siemon and Paessler bring together intelligent building technology and advanced monitoring and make your vision of intelligent buildings and data centers become reality.
Real-time notifications mean faster troubleshooting so that you can act before more serious issues occur.
Network Monitoring Software – Version 26.1.116.1532 (February 9th, 2026)
Download for Windows and cloud-based version PRTG Hosted Monitor available
English, German, Spanish, French, Portuguese, Dutch, Russian, Japanese, and Simplified Chinese
Network devices, bandwidth, servers, applications, virtual environments, remote systems, IoT, and more
Choose the PRTG Network Monitor subscription that's best for you


The IoT refers to a network of devices with embedded sensors, software, and network connectivity capabilities. These devices exchange information with each other and IoT systems using the internet.
An IoT device is a connected device used for measurement, data collection, and other tasks. They are often equipped with sensors and are able communicate over a network. Examples of IoT devices include connected thermostats, healthcare monitors, air quality readers, healthcare devices, and much more.
MQTT stands for Message Queuing Telemetry Transport. It is a lightweight messaging protocol for use in cases where clients need a small code footprint and are connected to unreliable networks or networks with limited bandwidth resources. It is primarily used for machine-to-machine (M2M) communication or Internet of Things types of connections.
PRTG monitors IoT devices by utilizing a wide range of sensors and protocols to gather data on the performance, health, and environment of connected devices. These PRTG sensors (not to be confused with IoT sensors) can track metrics like temperature, humidity, voltage, and connectivity, providing real-time insights into the status of your IoT infrastructure. PRTG can also monitor specific IoT protocols like MQTT and Modbus TCP, allowing you to track the flow of data between devices and applications.
This collected data can be presented in customizable dashboards, giving you a comprehensive overview of your IoT network. You can configure alerts to notify you of issues with IoT devices, enabling proactive troubleshooting and problem solving.
In PRTG, “sensors” are the basic monitoring elements. One sensor usually monitors one measured value in your network, for example the traffic of a switch port, the CPU load of a server, or the free space on a disk drive. On average, you need about 5-10 sensors per device or one sensor per switch port.
Paessler conducted trials in over 600 IT departments worldwide to tune its network monitoring software closer to the needs of sysadmins. The result of the survey: over 95% of the participants would recommend PRTG – or already have.

Paessler PRTG is used by companies of all sizes. Sysadmins love PRTG because it makes their job a whole lot easier.
Bandwidth, servers, virtual environments, websites, VoIP services – PRTG keeps an eye on your entire network.
Everyone has different monitoring needs. That’s why we let you try PRTG for free.