Custom alerts and data visualization let you quickly identify and prevent network issues that result from unavailable devices.
Your network is a battleground, and like it or not, you are the general in charge of winning the war against all things that jeopardize your infrastructure. Ever on the lookout, you spot a mortal enemy – high ping latency. You reach for your most potent weapon – Paessler PRTG. It watches the enemy and reports their every move. By conducting continuous ping and latency tests across various IP addresses, PRTG helps you identify bad actors before they bring your network’s walls down.
Diagnose network issues by continuously tracking average latency and response times using ping. Show bandwidth usage, packet loss, jitter, load times, and other key metrics in real time. Visualize monitoring data in clear graphs and dashboards to identify problems more easily. Gain the overview you need to troubleshoot network problems that result from high latency and unresponsive network devices.

Device tree view of the complete monitoring setup

Custom PRTG dashboard for keeping an eye on the entire IT infrastructure

Live traffic data graph in PRTG
“All-around winning
network monitor”
“The real beauty of PRTG is the endless possibilities it offers”
“PRTG Network Monitor
is very hard to beat”
PRTG offers an all-encompassing network monitoring solution that goes beyond basic latency checks.
From bandwidth usage to uptime, it's your command center for network management – much like a well-equipped arsenal for your IT infrastructure.
Set your own thresholds for latency, packet loss, and more. PRTG's flexible alerting system ensures you only receive notifications when it matters, reducing unnecessary distractions.
It's as precise as coordinating a tactical strike, ensuring you're alerted to issues that require immediate attention.
Despite its advanced features, PRTG is user-friendly. Whether you're monitoring via SNMP, ICMP ping, WMI, SSH, TCP, or setting up complex alerting rules, the interface is as intuitive as a well-drawn battle plan.
No matter if you’re running Windows or Linux systems or managing a diverse set of devices, PRTG makes network management a seamless experience. Plus, you can also use PRTG for game monitoring.
With support for various APIs and third-party tools, PRTG integrates smoothly into your existing workflow. Automate responses to certain network conditions, making your network defenses as efficient as a well-oiled machine.
This level of automation allows you to allocate resources more effectively, focusing on innovation rather than firefighting.
PRTG comes with more than 250 native sensor types for monitoring your entire on-premises, cloud, and hybrid cloud environment out of the box. Check out some examples below!
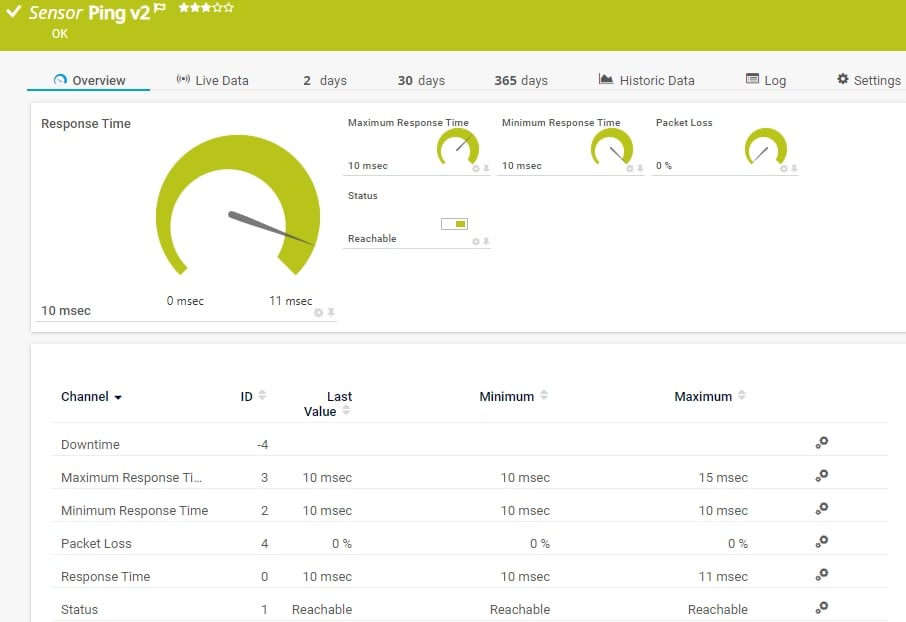
The Ping v2 sensor sends an Internet Control Message Protocol (ICMP) echo request ("ping") from the probe system to the parent device to monitor its availability. It can show the following:
• Response time
• Packet loss
• Target status
• Minimum and maximum ping time
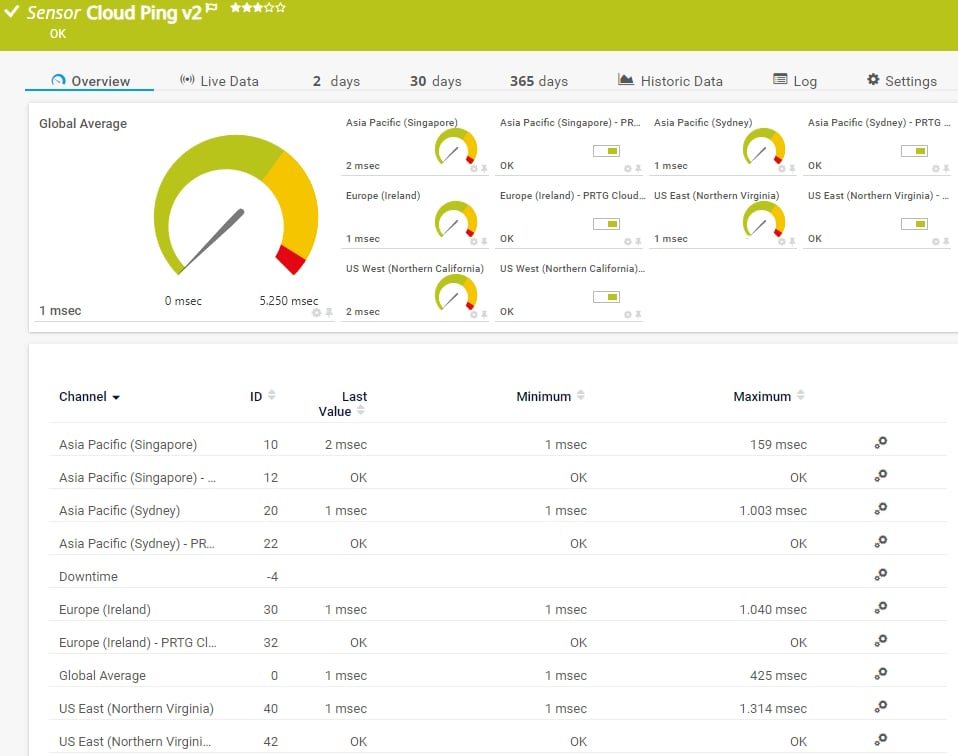
The Cloud Ping v2 sensor monitors the Transmission Control Protocol (TCP) ping times to its parent device from different locations worldwide (Asia Pacific: Singapore, Asia Pacific: Sydney, Europe: Ireland, US East: Northern Virginia, US West: Northern California) via the PRTG Cloud. It can show the following:
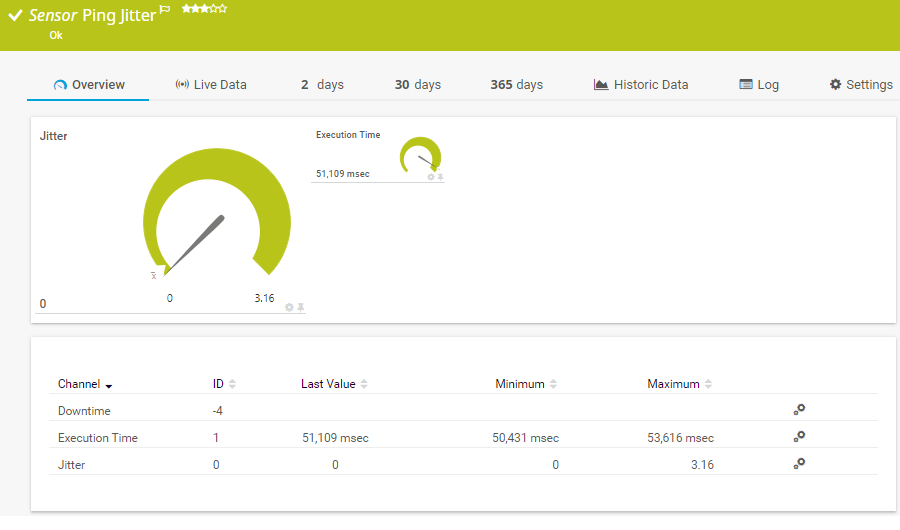
The Ping Jitter sensor sends a series of Internet Control Message Protocol (ICMP) echo requests ("pings") to a URI to determine the statistical jitter. It can show the following:
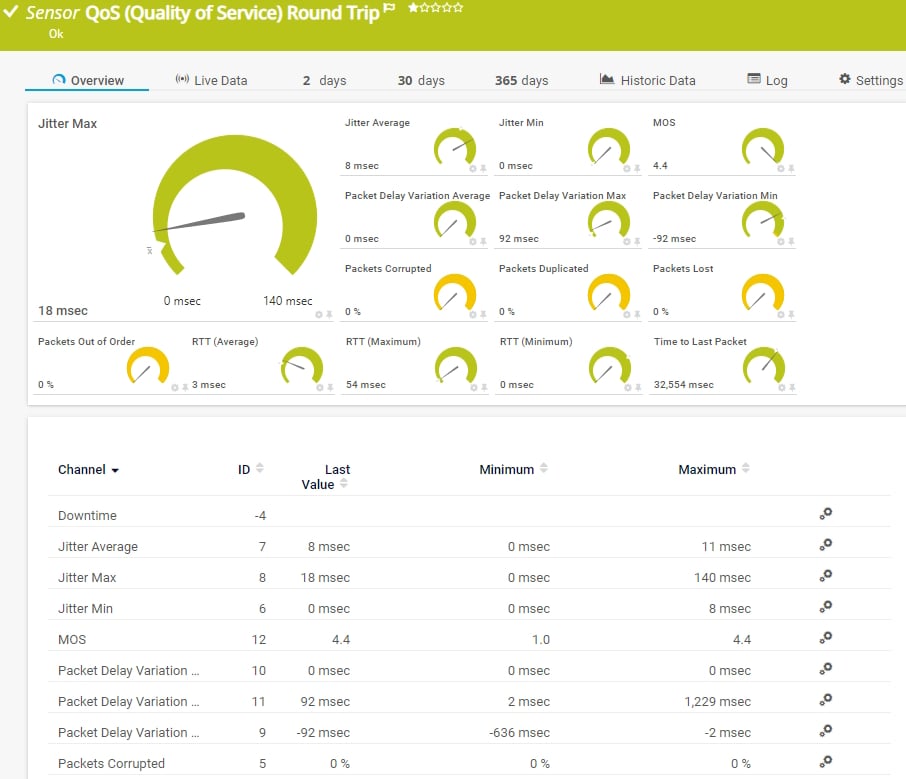
The QoS (Quality of Service) Round Trip sensor monitors parameters regarding the quality of a network connection between two probes. It can show the following:
See the PRTG Manual for a list of all available sensor types.

Custom alerts and data visualization let you quickly identify and prevent network issues that result from unavailable devices.
PRTG is set up in a matter of minutes and can be used on a wide variety of mobile devices.


“Excellent tool for detailed monitoring. Alarms and notifications work greatly. Equipment addition is straight forward and server initial setup is very easy. ...feel safe to purchase it if you intend to monitor a large networking landscape.”
Partnering with innovative IT vendors, Paessler unleashes synergies to create
new and additional benefits for joined customers.
IT that works constitutes a business-critical basis for a company's success. Availability and security must be defined for the respective purpose and closely monitored – by OT and IT alike.
Integrating monitoring results from PRTG into NetBrain maps makes the foundation for network automation.
With ScriptRunner Paessler integrates a powerful event automation platform into PRTG Network Monitor.
Real-time notifications mean faster troubleshooting so that you can act before more serious issues occur.
Network Monitoring Software – Version 26.1.116.1532 (February 9th, 2026)
Download for Windows and cloud-based version PRTG Hosted Monitor available
English, German, Spanish, French, Portuguese, Dutch, Russian, Japanese, and Simplified Chinese
Network devices, bandwidth, servers, applications, virtual environments, remote systems, IoT, and more
Choose the PRTG Network Monitor subscription that's best for you


Ping latency monitoring is the continuous measurement of network response times using ICMP echo requests. Effective ping latency monitoring helps identify network congestion, routing issues, and hardware problems before they affect users.
By implementing comprehensive ping latency monitoring, organizations can establish performance baselines, detect anomalies quickly, and maintain optimal network performance. Regular ping latency monitoring also provides valuable data for capacity planning and infrastructure upgrades.
While bandwidth monitoring tracks data volume, ping latency monitoring specifically measures response time between devices. Ping latency monitoring provides immediate feedback on network health through round-trip time measurements, making it ideal for real-time troubleshooting.
Unlike protocol-specific monitoring, ping latency monitoring works across virtually all network devices, regardless of operating system or hardware type. This universal compatibility makes ping latency monitoring an essential component of comprehensive network management strategies.
Absolutely. PRTG can monitor latency to various cloud services and providers, ensuring that your connections to the cloud are reliable. This helps you maintain optimal performance for cloud-based applications and services, extending your network oversight to all fronts of the digital battlefield.
Effective ping latency monitoring should focus on several key metrics: round-trip time (RTT), packet loss percentage, and jitter (variation in latency). When implementing ping latency monitoring, establish baseline values for each metric under normal conditions.
Configure alerts when measurements exceed these thresholds. Advanced ping latency monitoring should also track trends over time, allowing administrators to identify gradual performance degradation before it reaches critical levels.
Yes, PRTG supports monitoring across various operating systems, including Windows, Linux, and macOS. It also monitors a wide range of network devices, from routers and switches to servers and virtual machines. Think of it as equipping your entire army with the tools they need to perform effectively, ensuring interoperability and seamless communication across all units.
PRTG provides tools like traceroute and detailed metrics on network paths, helping you pinpoint where latency issues are occurring. By analyzing data from multiple points, you can identify whether the problem lies with specific endpoints, routers, or network segments. It's like having reconnaissance reports that help you target and eliminate the source of the problem swiftly and efficiently.
In PRTG, “sensors” are the basic monitoring elements. One sensor usually monitors one measured value in your network, for example the traffic of a switch port, the CPU load of a server, or the free space on a disk drive. On average, you need about 5-10 sensors per device or one sensor per switch port.
Paessler conducted trials in over 600 IT departments worldwide to tune its network monitoring software closer to the needs of sysadmins. The result of the survey: over 95% of the participants would recommend PRTG – or already have.

Paessler PRTG is used by companies of all sizes. Sysadmins love PRTG because it makes their job a whole lot easier.
Bandwidth, servers, virtual environments, websites, VoIP services – PRTG keeps an eye on your entire network.
Everyone has different monitoring needs. That’s why we let you try PRTG for free.