Custom alerts and data visualization let you quickly identify and prevent hardware failures, data loss, and security vulnerabilities.
Do you know how many workstations, laptops, routers, mobile devices, and other hardware assets, software solutions, and other components and endpoints are connected to your network?
It’s not a rhetorical question.
IT inventory management is critically important. How can you make sure your network is performing optimally, and that it’s secure, let alone carry out prompt and effective troubleshooting, when you don’t even know what’s connected to your network and who’s using it?
Paessler PRTG’s IT asset management maps out your entire network in minutes.
You’ll have a crystal clear idea of what’s connected to your network and the condition it’s in. And, with comprehensive inventory data at your fingertips, your service desk will have an easier time solving issues, optimizing performance, and planning ahead so your network is always well-placed to meet your colleagues’ and customers’ needs.

Install PRTG, key in your preferred IP address range, and you're good to go. The automatic network discovery automatically creates a comprehensive IT inventory.
Better still, it assigns the right monitoring sensors, so you can start tracking all your network devices and other key metrics straight away.
A complete, clear view of laptops, routers, and other hardware assets, software solutions, upgrades, and other components, plus all your data in one place.
With PRTG, you won’t have to switch between multiple environments, which means more effective IT inventory management.
Prevent data loss, underperformance, crashes, and other disruptions, before they, well, disrupt your organization.
Pick your preferred performance thresholds, and you'll get notified as soon as anything looks like it might put your network at risk.
No more security loopholes. PRTG monitors every aspect of your network around the clock – 24 hours a day, 7 days a week.
Problems with firewalls are detected immediately. And in the event of an incident (e.g., a malware attack related to a sudden spike in bandwidth), PRTG automatically notifies you at once.
Diagnose network issues by continuously monitoring hardware, applications, operating systems, and other network components. Show software and hardware asset lifecycle, configuration details, user permissions, updates, and other key metrics in real time. Visualize monitoring data in clear graphs and dashboards to identify problems more easily. Gain the overview you need to troubleshoot inefficient resource allocation, security vulnerabilities, and other network health problems.

Live traffic data graph in PRTG

Device tree view of the complete monitoring setup

Custom PRTG dashboard for keeping an eye on the entire IT infrastructure
Live traffic data graph in PRTG
Device tree view of the complete monitoring setup
“All-around winning
network monitor”
“The real beauty of PRTG is the endless possibilities it offers”
“PRTG Network Monitor
is very hard to beat”
The heart of PRTG's computer inventory management system is the auto-discovery, which launches automatically when you install our monitoring tool.
Define an IP address range, and PRTG detects and categorizes every hardware and software device in that range, creating a comprehensive, central asset inventory you can access from the monitoring dashboard.
PRTG also has preconfigured sensors for round the clock asset tracking, including:
You can also create custom sensors to monitor software licenses and other parameters, such as purchase dates, warranty status, and patch management.
PRTG comes with more than 250 native sensor types for monitoring your entire on-premises, cloud, and hybrid cloud environment out of the box. Check out some examples below!
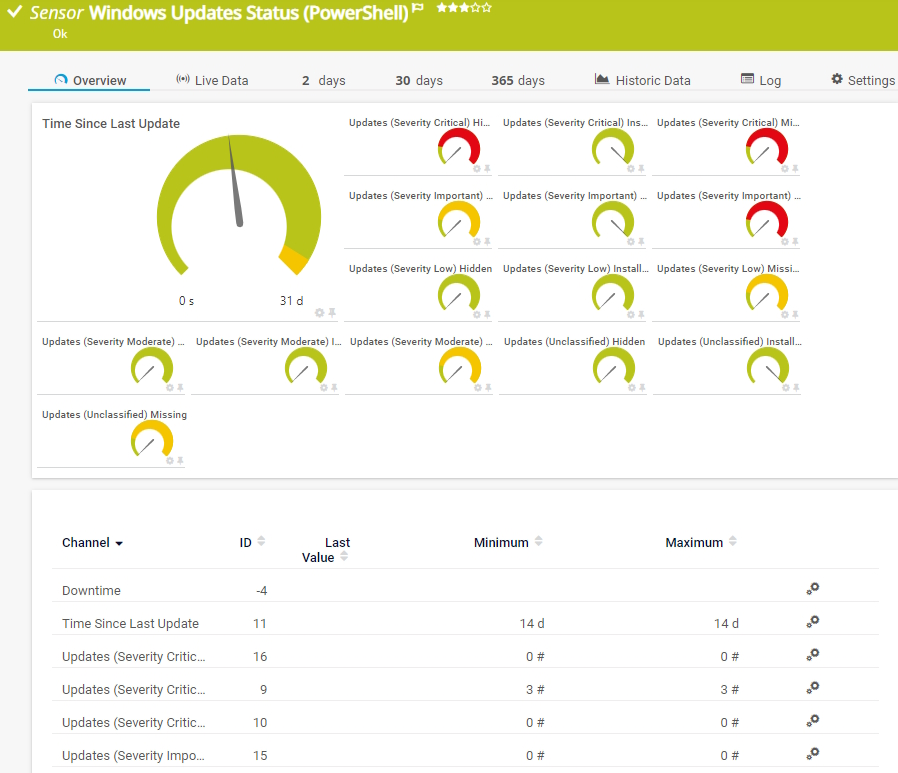
The Windows Updates Status (PowerShell) sensor monitors the status of Windows updates on a computer and counts the available and installed Windows updates that are either from Microsoft or from the local Windows Server Update Services (WSUS) server. It can show the following:
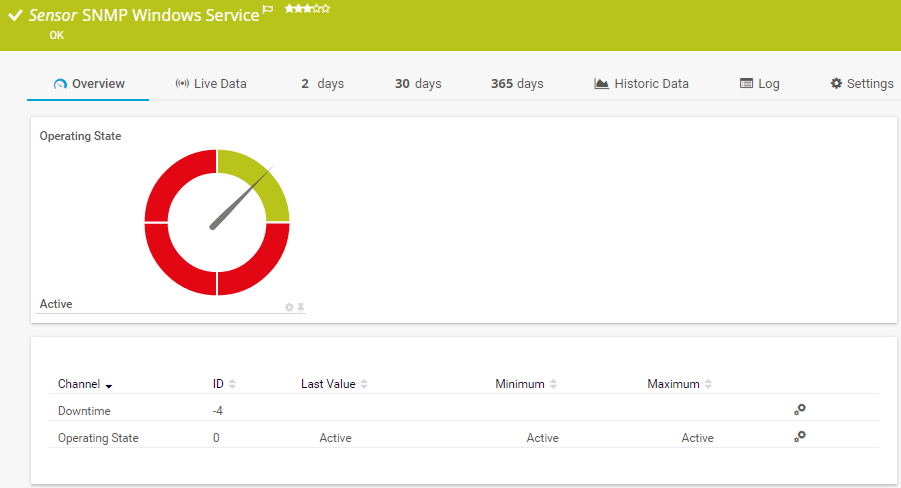
The SNMP Windows Service sensor monitors a Windows service. It can show the following:
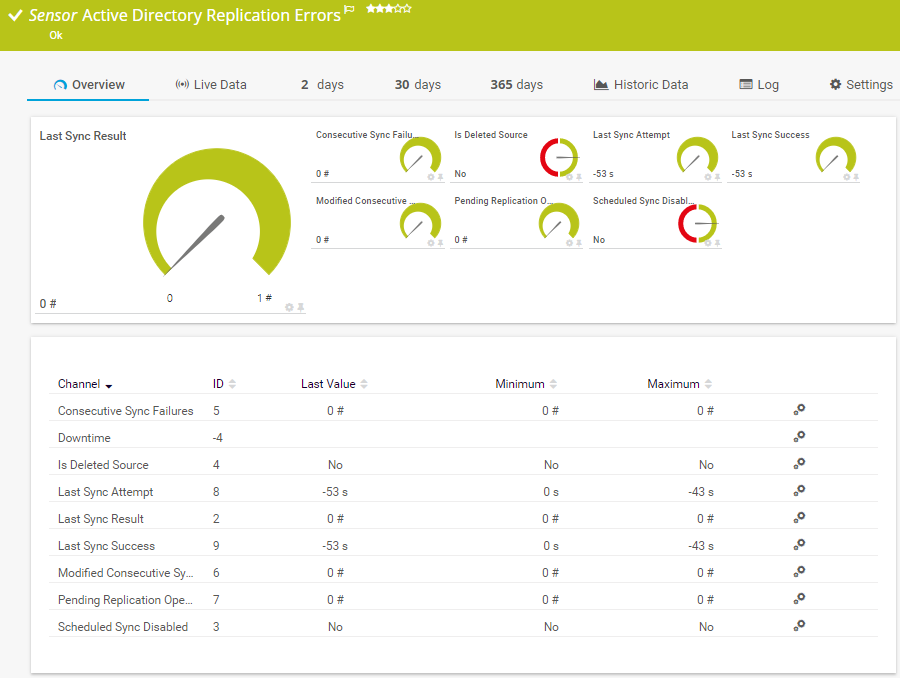
The Active Directory Replication Errors sensor checks a Windows domain controller (DC) for replication errors. It can show the following:
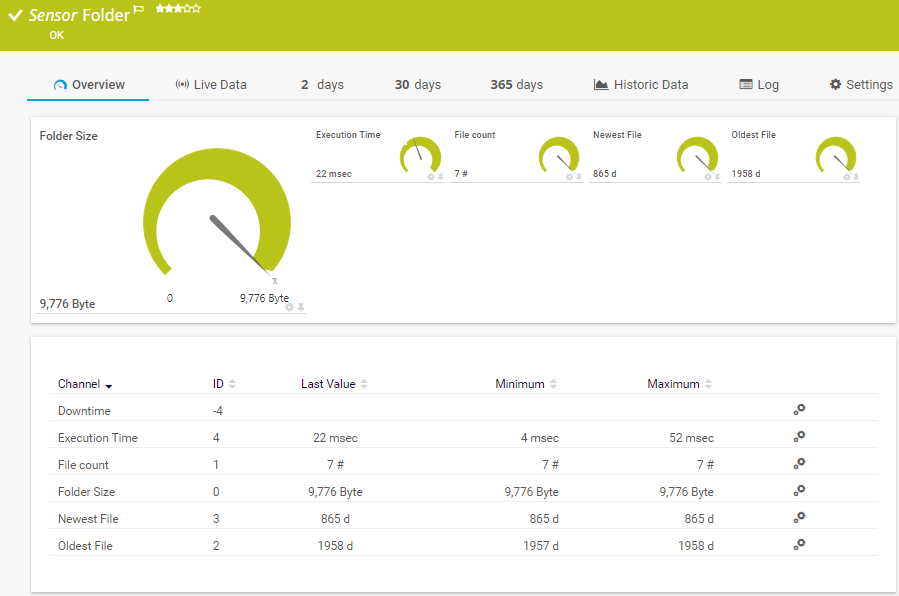
The Folder sensor monitors a folder via Server Message Block (SMB). You can monitor file changes and file ages. It can show the following:
See the PRTG Manual for a list of all available sensor types.

Real-time notifications mean faster troubleshooting so that you can act before more serious issues occur.
PRTG is set up in a matter of minutes and can be used on a wide variety of mobile devices.


“Excellent tool for detailed monitoring. Alarms and notifications work greatly. Equipment addition is straight forward and server initial setup is very easy. ...feel safe to purchase it if you intend to monitor a large networking landscape.”
Partnering with innovative IT vendors, Paessler unleashes synergies to create
new and additional benefits for joined customers.

Paessler and Plixer provide a complete solution adding flow and metadata analysis to a powerful network monitoring tool.

With ScriptRunner Paessler integrates a powerful event automation platform into PRTG Network Monitor.
Custom alerts and data visualization let you quickly identify and prevent hardware failures, data loss, and security vulnerabilities.
Network Monitoring Software – Version 25.1.104.1946 (March 18th, 2025)
Download for Windows and cloud-based version PRTG Hosted Monitor available
English, German, Spanish, French, Portuguese, Dutch, Russian, Japanese, and Simplified Chinese
Network devices, bandwidth, servers, applications, virtual environments, remote systems, IoT, and more
Choose the PRTG Network Monitor subscription that's best for you


In an enterprise network scenario, computer inventory management is the process of identifying, cataloguing, and tracking the status of every hardware and software component that forms part of your IT infrastructure. The idea is to have a complete list of all the resources at your disposal, together with important information such as:
Because a computer inventory management system makes it much easier to stay on top of your IT infrastructure on an ongoing basis, especially if it has automation functions. You’ll always know the status of your connected devices, whether hardware, software, or cloud-based, and can take steps to optimize your entire network’s performance (and fix issues as they arise). Most importantly, you can plan ahead, ensuring you always have enough capacity to meet your growing organization’s demands on your network.
PRTG automatically detects every hardware, software, and virtual component within your selected IP address range, and brings them all together in one central dashboard, creating a complete network inventory of your organization’s computer assets. Sophisticated sensors then monitor key metrics and alert you if there’s a risk of performance or security issues, so you can address them straight away, before they disrupt your organization (and your colleagues start complaining).
In PRTG, “sensors” are the basic monitoring elements. One sensor usually monitors one measured value in your network, for example the traffic of a switch port, the CPU load of a server, or the free space on a disk drive. On average, you need about 5-10 sensors per device or one sensor per switch port.
Paessler conducted trials in over 600 IT departments worldwide to tune its network monitoring software closer to the needs of sysadmins. The result of the survey: over 95% of the participants would recommend PRTG – or already have.

Paessler PRTG is used by companies of all sizes. Sysadmins love PRTG because it makes their job a whole lot easier.
Bandwidth, servers, virtual environments, websites, VoIP services – PRTG keeps an eye on your entire network.
Everyone has different monitoring needs. That’s why we let you try PRTG for free.