Custom alerts and data visualization let you quickly identify and prevent application performance issues.
How is your software doing? Are all applications running smoothly, or do you need to make some changes here and there? When you monitor software with Paessler PRTG, all answers to these questions are just one click away.
Use our dedicated sensors to keep an eye on system uptime and downtime. This way, everything will be under your control.
There are lots of reasons why your software might not be running as it should. From wrong configurations to problems with Windows operating systems to hardware-software interaction. Whatever the reason, it’s likely you’ll find the answer looking at logs.
Sensors and error tracking options are just a two ways PRTG software monitoring helps you do this in a quick and easy way.
Observability is key to understanding how users experience and work with software. When you analyze metrics like page load times, resource utilization, or response times, you can implement long-lasting optimization measures.
This type of performance monitoring will lead to necessary improvements that will take end-user experience to a whole new level.
Learning from past trends will help you succeed in the future. This isn’t only true in personal life, but also applies to software monitoring and functionality. To get you started, PRTG is equipped with a comprehensive, out-of-the-box reporting feature.
Create historical data reports automatically or on demand and start a data-driven approach to adapt the scalability of your applications to the current company requirements.
Diagnose network issues by continuously tracking the availability, health, and performance of applications, processes, and services. Show software dependencies, front-end performance, other key metrics in real time. Visualize monitoring data in clear graphs and dashboards to identify problems more easily. Gain the overview you need to troubleshoot issues with on-premises Microsoft applications, as well as cloud-based SaaS solutions like Azure or AWS.

Live traffic data graph in PRTG

Device tree view of the complete monitoring setup

Custom PRTG dashboard for keeping an eye on the entire IT infrastructure
Live traffic data graph in PRTG
Device tree view of the complete monitoring setup
“All-around winning
network monitor”
“The real beauty of PRTG is the endless possibilities it offers”
“PRTG Network Monitor
is very hard to beat”
Even the most advanced software needs strong hardware to function properly. If this support is lacking, it can never reach its full potential. That’s why hardware monitoring is such an important part of a holistic software monitoring strategy.
To check how your hardware is doing PRTG’s dedicated hardware sensors will provide you with meaningful results. You will always know if everything is working together as it should.
Even the most detailed IT infrastructure plan can run into problems over time. Small issues with server performance or bandwidth can become bottlenecks. This is not only frustrating, it can also affect how the applications you use perform.
With PRTG infrastructure monitoring, it’s never been easier to keep an eye on your entire network. Distribute resources where they are needed or see which component is ready for an upgrade.
Stay informed and act fast with PRTG’s fully customizable alerting and notification system. Not everyone needs to be informed about a specific incident, even though you have a lot of people working on the project? No problem.
No matter how, when, or where you need to be informed, with PRTG you can easily set up different notification methods including escalation levels that alert only the people that need to be alerted.
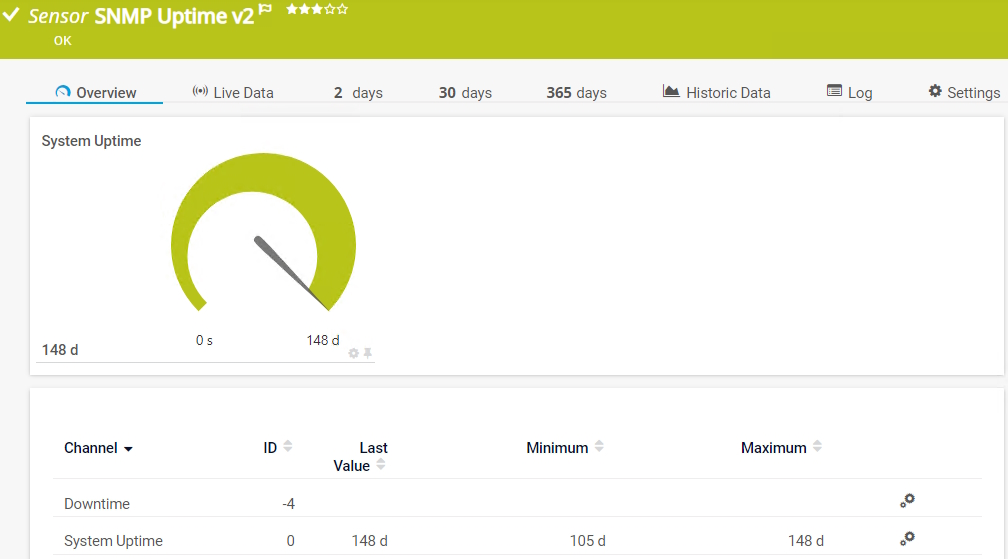
PRTG comes with more than 250 native sensor types for monitoring your entire on-premises, cloud, and hybrid cloud environment out of the box. Check out some examples below!
The SNMP Uptime v2 sensor monitors the uptime of a device. It can show the following:
The Event Log (Windows API) sensor monitors event log entries via the Windows API. It can show the following:
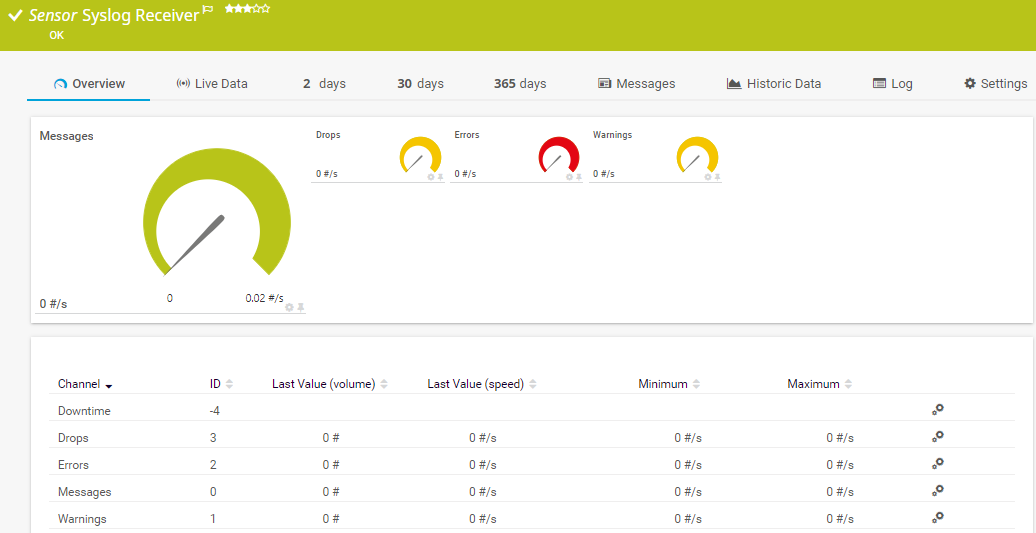
The Syslog Receiver sensor receives and analyzes Syslog messages. It can show the following:
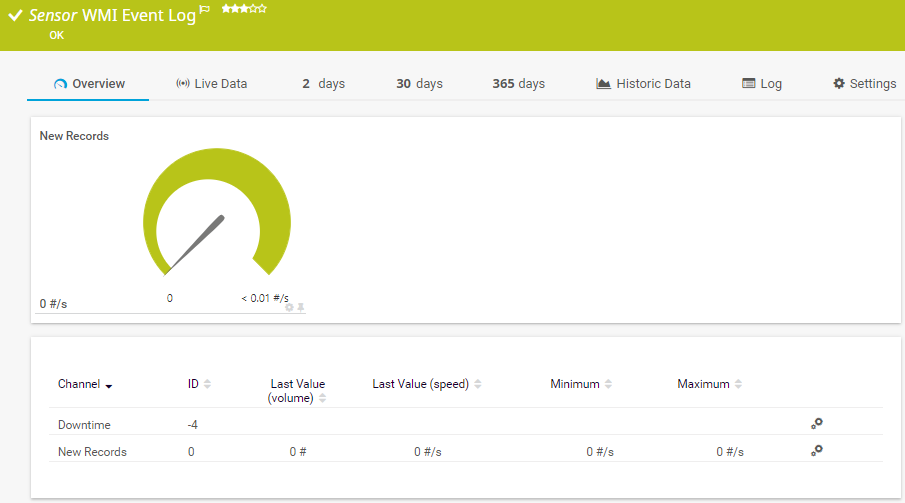
The WMI Event Log sensor monitors a Windows log file. It can show the following:
See the PRTG Manual for a list of all available sensor types.

Custom alerts and data visualization let you quickly identify and prevent issues like applications performance or bottlenecks.
PRTG is set up in a matter of minutes and can be used on a wide variety of mobile devices.

Paessler achieved VMware's highest level of endorsement due to our technological excellence, leading market position, and superior compatibility with VMware products.
What does this mean for you?
Partnering with innovative IT vendors, Paessler unleashes synergies to create
new and additional benefits for joined customers.

Paessler and Plixer provide a complete solution adding flow and metadata analysis to a powerful network monitoring tool.

UVexplorer integrates tightly with PRTG to bring fast and accurate network discovery, detailed device inventory, and automatic network mapping to the PRTG platform.
By integrating PRTG with Martello iQ, you can add a fast analytics layer to improve uptime, visualize your IT environment, and integrate all of your IT systems into a single pane of glass.
Real-time notifications mean faster troubleshooting so that you can act before more serious issues occur.
Network Monitoring Software – Version 24.4.102.1351 (November 12th, 2024)
Download for Windows and cloud-based version PRTG Hosted Monitor available
English, German, Spanish, French, Portuguese, Dutch, Russian, Japanese, and Simplified Chinese
Network devices, bandwidth, servers, applications, virtual environments, remote systems, IoT, and more
Choose the PRTG Network Monitor subscription that's best for you
Software monitoring is the process of tracking the performance, health, and functionality of software applications to ensure they run smoothly. It identifies issues, optimizes resource usage, and maintains overall system stability. Think of it as a kind of automation that always runs in the background. It collects data that you can use to make decisions.
Software monitoring is essential for identifying issues before they lead to costly downtime and ensure smooth, uninterrupted operations. Use your monitoring system to optimize resource usage and performance monitoring. This prevents bottlenecks and maintains system reliability.
Effective monitoring also enhances application performance, leading to better user experiences and increased satisfaction.
Software monitoring ultimately helps reduce operational costs and strengthens reliability, supporting long-term business growth. It provides the data needed for you to manage and improve your workflow.
PRTG is developed to manage both simple and complex IT environments. It monitors on-premises systems, cloud-based infrastructure, or hybrid setups. It is flexible and can handle any number of networks or architectures. It has an extensive range of sensor types and customization options.
Paessler PRTG is an all-in-one monitoring solution that provides insights into software and hardware, giving you a complete view of your IT environment. It tracks performance across all devices and applications, ensuring everything works seamlessly together.
By covering everything from server health to application performance, PRTG helps prevent potential issues. This approach simplifies IT management.
There are significant differences between open-source and paid monitoring tools – and it’s not just the pricing or the use of Linux. Open-source tools are free and highly customizable, offering flexibility for those with in-depth technical expertise.
However, they require more setup, maintenance, and support, which is often community-driven rather than professional. Moreover, they often have a steep learning curve.
Paid solutions like PRTG are typically developed to have user-friendly interfaces, provide professional support, and include comprehensive features that work out-of-the-box. For businesses that prioritize reliability and quick deployment, paid tools with variable pricing plans are more efficient and time-saving.
In PRTG, “sensors” are the basic monitoring elements. One sensor usually monitors one measured value in your network, for example the traffic of a switch port, the CPU load of a server, or the free space on a disk drive. On average, you need about 5-10 sensors per device or one sensor per switch port.
Paessler conducted trials in over 600 IT departments worldwide to tune its network monitoring software closer to the needs of sysadmins. The result of the survey: over 95% of the participants would recommend PRTG – or already have.

Paessler PRTG is used by companies of all sizes. Sysadmins love PRTG because it makes their job a whole lot easier.
Bandwidth, servers, virtual environments, websites, VoIP services – PRTG keeps an eye on your entire network.
Everyone has different monitoring needs. That’s why we let you try PRTG for free.