![]()
Web Service Monitoring with PRTG
Take control of your web service performance with all-in-one monitoring
- Keep web services fast and reliable with real-time tracking and alerts
- Prevent downtime by monitoring website availability and SSL certificate expiry
- Simplify monitoring with one tool for web, virtual, and cloud services
Our users give top ratings for monitoring with Paessler PRTG


PRTG web service monitoring: What you’ll find on this page

PRTG makes web service monitoring as easy as it gets
Custom alerts and data visualization let you quickly identify and prevent service disruptions and other performance issues.
Keep your web services running like a champ with PRTG
Web services are the backbone of modern business. Paessler PRTG's web service monitoring makes sure everything stays healthy, from HTTP status to response times. You'll catch issues before users do, optimize performance, and reduce troubleshooting time.
Keep a close eye on performance
Your web service doesn't live in a vacuum. PRTG tracks HTTP request-response times, DNS resolution times, and web server availability with continuous performance monitoring.
A clear line of sight into your performance data promptly reveals stress points in APIs, websites, and microservices, so you can address specific bottlenecks before they affect user experience.
Stay ahead with proactive monitoring
Don't wait for users to report problems – catch them first. PRTG's synthetic monitoring proactively simulates user interactions and HTTP transactions to test the availability, response times, and endpoint functionality of your web services, web servers, and websites.
This way, you're always one step ahead of outages, slowdowns, and broken endpoints.
Guard against downtime like a pro
Downtime is your enemy, and PRTG keeps you ahead of service interruptions. Using built-in automation, PRTG continuously checks for issues like 404/503 errors, service disruptions, and abnormal response times, alerting you as soon as there’s an issue.
The result? Faster detection, quicker response times, less downtime, and high cost savings.
Track SSL certificate expiration dates
TLS and SSL certificates are easy to overlook – until users see browser warnings or experience service disruptions. PRTG keeps tabs on SSL/TLS certificates to make sure they're valid, up-to-date, and compliant.
You'll receive proactive notifications before expiration, helping you avoid costly service failures and maintain customer trust.
Benchmark your service quality
Don't just hope your web service is fast – prove it. PRTG tracks web application performance, measuring page load times, responsiveness, and uptime.
Generate reports with hard data to share with your team, identify areas for optimization, and make performance-driven decisions to meet your SLAs.
What web service application monitoring looks like in PRTG
Diagnose network issues by continuously tracking the availability and performance of your web services. Show uptime, CPU usage, disk space, response time, load times, and other key metrics in real time. Visualize monitoring data in clear graphs and dashboards to identify problems more easily. Gain the overview you need to troubleshoot service disruptions and other performance issues.

Device tree view of the complete monitoring setup
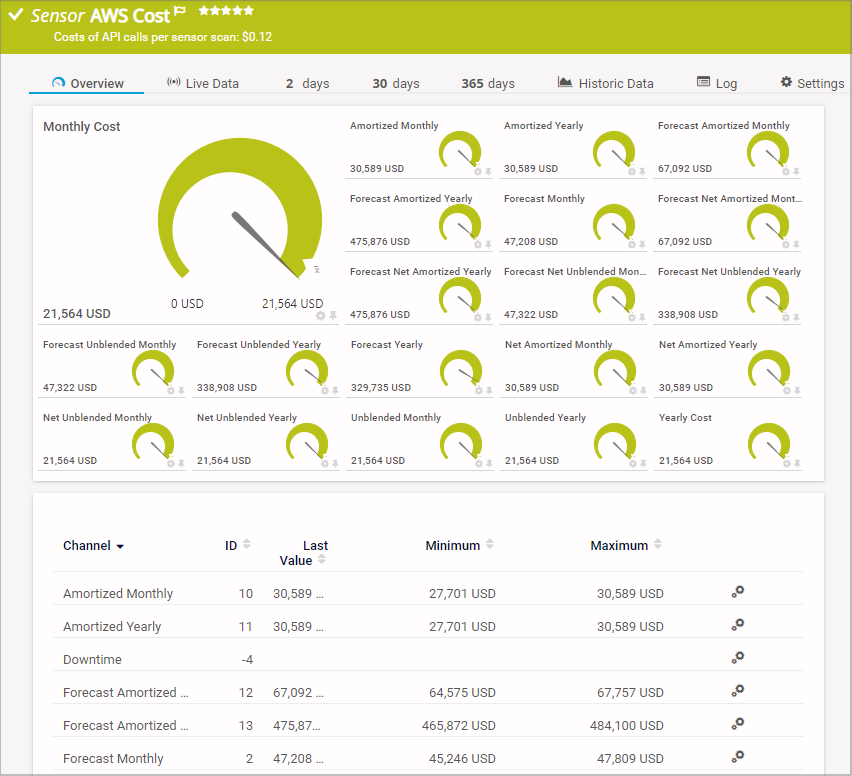
Preconfigured AWS Cost sensor in PRTG

Custom PRTG dashboard for keeping an eye on the entire IT infrastructure
Start monitoring web services with PRTG and see how it can make your network more reliable and your job easier.
IT experts agree: Paessler PRTG is a great solution for IT infrastructure monitoring

“All-around winning
network monitor”

“The real beauty of PRTG is the endless possibilities it offers”

“PRTG Network Monitor
is very hard to beat”
4 more reasons to choose PRTG as your web service monitoring tool
PRTG gives you the clarity, control, and confidence to keep every API, website, and app running like a dream. Don't just watch it – control it.
You need real-time alerts when it matters most
If your web service, website, or application goes down, you'll know before your customers do. PRTG alerts you via SMS, email, push notification, and other methods.
Stay ahead of service interruptions, avoid complaints, and keep your business running smoothly. Customizable thresholds let you decide what issues require immediate action so you're not overwhelmed by alert fatigue.
You need all-in-one network monitoring for simplicity
Stop juggling multiple tools – PRTG brings them all together. Our software provides website monitoring, database monitoring, firewall monitoring, server monitoring, uptime monitoring, cloud monitoring, and more from a single, centralized dashboard.
See it all in one place, and manage your entire IT infrastructure like a pro. This consolidation reduces tool sprawl, cuts costs, and simplifies monitoring for your DevOps team.
You need multi-vendor support for total compatibility
PRTG plays nice with everyone. It supports monitoring a wide range of software, hardware, and service providers, including Microsoft and Linux, popular APM tools, and frontend technologies.
From cloud platforms to on-premise infrastructure, integration with hybrid IT environments is easy, whether you're working with Windows servers, gateways, or custom-built applications.
You need a fast setup with no coding required
Skip the headaches of starting from scratch. PRTG web service monitoring comes with many pre-configured sensors that start monitoring in minutes.
Just set up, activate, and you're ready to track every aspect of your web services with minimal hassle. Reduce onboarding time with PRTG and let your team focus on critical development tasks.
Your web service monitor at a glance – even on the go
Set up PRTG in minutes and use it on almost any mobile device.


Explore our preconfigured PRTG sensors for web services monitoring
PRTG comes with more than 250 native sensor types for monitoring your entire on-premises, cloud, and hybrid cloud environment out of the box. Check out some examples below!
Find the root cause of the problem with our PRTG web service monitoring solution
Real-time notifications mean faster troubleshooting so that you can act before more serious issues occur.
PRTG is compatible with all major vendors, products, and systems
![]()
Create innovative solutions with Paessler’s partners
Partnering with innovative vendors, Paessler unleashes synergies to create
new and additional benefits for joined customers.


ScriptRunner
With ScriptRunner, Paessler integrates a powerful event automation platform into PRTG Network Monitor.

UVnetworks
UVexplorer integrates tightly with PRTG to bring fast and accurate network discovery, detailed device inventory, and automatic network mapping to the PRTG platform.
“Excellent tool for detailed monitoring. Alarms and notifications work greatly. Equipment addition is straight forward and server initial setup is very easy. ...feel safe to purchase it if you intend to monitor a large networking landscape.”
Infrastructure and Operations Engineer in the Communications Industry, firm size 10B - 30B USD
PRTG makes web service monitoring as easy as it gets
Custom alerts and data visualization let you quickly identify and prevent service disruptions and other performance issues.

PRTG: The multi-tool for sysadmins
Adapt PRTG individually and dynamically to your needs and rely on a strong API:- HTTP API: Access monitoring data and manipulate monitoring objects via HTTP requests
- Custom sensors: Create your own PRTG sensors for customized monitoring
- Custom notifications: Create your own notifications and send action triggers to external systems
- REST Custom sensor: Monitor almost everything that provides data in XML or JSON format
We asked: would you recommend PRTG?
Over 95% of our customers say yes!
Paessler conducted trials in over 600 IT departments worldwide to tune its network monitoring software closer to the needs of sysadmins.
The result of the survey: over 95% of the participants would recommend PRTG – or already have.

Still not convinced?
![]()
More than 500,000
sysadmins love PRTG
Paessler PRTG is used by companies of all sizes. Sysadmins love PRTG because it makes their job a whole lot easier.
![]()
Monitor your entire IT infrastructure
Bandwidth, servers, virtual environments, websites, VoIP services – PRTG keeps an eye on your entire network.
![]()
Try Paessler PRTG
for free
Everyone has different monitoring needs. That’s why we let you try PRTG for free.
![]()
Start monitoring web services with PRTG and see how it can make your network more reliable and your job easier.
|
PRTG |
Network Monitoring Software - Version 25.1.104.1961 (April 7th, 2025) |
|
Hosting |
Download for Windows and cloud-based version PRTG Hosted Monitor available |
Languages |
English, German, Spanish, French, Portuguese, Dutch, Russian, Japanese, and Simplified Chinese |
Pricing |
Up to 100 sensors for free (Price List) |
Unified Monitoring |
Network devices, bandwidth, servers, applications, virtual environments, remote systems, IoT, and more |
Supported Vendors & Applications |
|
Discover more monitoring insights and stories

Solutions for all your monitoring needs

Powerful stories from the monitoring world
