![]()
Paessler PRTG – A better alternative to VMware vRealize Operations
- Keep an eye on your entire virtualized environment
- Also track your server hardware and other network components
- Monitor on many levels from virtual machines to guest OS
Our users give top ratings for monitoring with Paessler PRTG


PRTG as a VMware alternative: What you’ll find on this page

PRTG vs. VMware vRealize Operations: All-in-one network monitoring, virtualized or not
PRTG is the perfect complement to VMware monitoring software, providing the comprehensive scope of monitoring that VMware is lacking.
VMware vRealize Operations (formerly vSphere Operations Manager) compiles server load data and facilitates capacity planning. It provides detailed information on the performance of your vSphere environment and helps you to effectively allocate resources to virtual machines and optimize loads.
However, PRTG does something VMware vRealize Operations cannot do: PRTG also monitors components such as server hardware along with other vendors of virtualized environments (Citrix, Microsoft Hyper-V), hybrid cloud infrastructure and cloud services (Azure, AWS, Nutanix), Windows and Linux operating systems, as well as your entire IT infrastructure.
In fact, PRTG can monitor all the other elements and services in your network, such as the bandwidth usage of your applications, the availability and performance of your websites, and the available disk space of your network drives.
Fast setup and intuitive usability
Network monitoring should be quick and easy. Cumbersome and complicated software creates unnecessary work for the administrator. PRTG makes monitoring as user-friendly as possible – no matter if you choose an on-prem installation or our cloud-based product.
Quick installation with automatic network discovery and smart setup for instant monitoring
Different user interfaces for web, desktop, and mobile apps for monitoring on the go
Custom dashboard creation via drag & drop with easy-to-read visualized overviews
Network of qualified implementation partners to support you with a smooth migration to PRTG
Start monitoring your network with PRTG and see how it can make your network more reliable and your job easier.
IT experts agree: Paessler PRTG is a great solution for IT infrastructure monitoring

“All-around winning
network monitor”

“The real beauty of PRTG is the endless possibilities it offers”

“PRTG Network Monitor
is very hard to beat”
What network monitoring looks like in PRTG
Diagnose network issues by continuously tracking the health, availability, and performance of your entire IT infrastructure. Show hardware parameters, application performance, network traffic, bandwidth usage, and other key metrics in real time. Visualize data in clear graphs and dashboards to identify problems more easily. Gain the overview you need to troubleshoot all kinds of issues in your network.

Device tree view of the complete monitoring setup
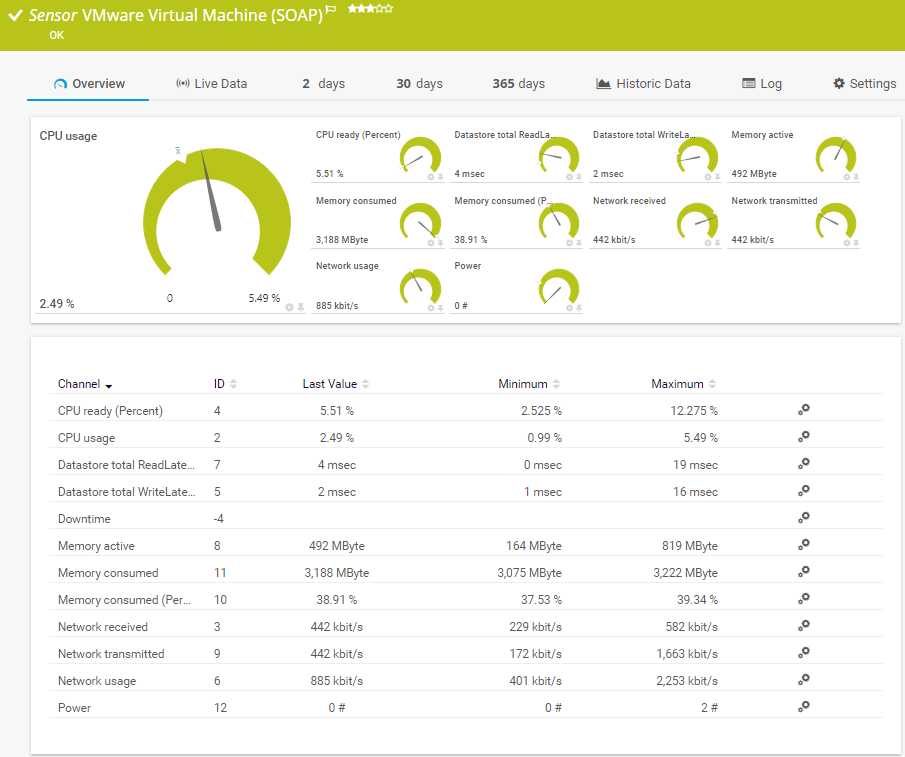
VMware Virtual Machine (SOAP) sensor in PRTG

Custom PRTG dashboard for keeping an eye on the entire IT infrastructure
Find the root cause of the problem with our PRTG network monitoring solution
Real-time notifications mean faster troubleshooting so that you can act before more serious issues occur.
PRTG is compatible with all major vendors, products, and systems
![]()
Comprehensive virtual network monitoring on many different levels
VMware vRealize Operations monitoring is limited to the “internal view” of the virtual environment. With PRTG, you can monitor your VMware environment on many different levels – from hardware to the services on your virtual machines.
Check physical servers from various manufacturers
Every VMware virtual environment runs on a physical server. PRTG comes with many built-in sensors for the most important manufacturers such as HPE, Dell, Fujitsu, or IBM. Hardware parameters that PRTG monitors include CPU temperature, power supply, and the fan status.
Keep an eye on the server hardware of the ESXi host
PRTG provides additional information on the hardware behind your virtual environment with the ESXi hypervisor.
The VMware Host Hardware Status (SOAP) sensor monitors the hardware status of a VMware host server. It displays the total number of elements in the normal, warning, and alert status reported by the vSphere Client.
The VMware Host Hardware (WBEM) sensor is perfect for obtaining more detailed information on the hardware behind your virtual components. By using the management IP address of your ESXi server as a parent device, you’ll receive data on the hardware’s temperature, power supply, and fans (RPM).
Monitor virtual machines as seen by the hypervisor
Along with the hardware, PRTG can of course be used to monitor the virtual machines themselves. When monitoring from outside, you’ll get all the data on the virtual machines that is collected by your ESXi hypervisor.
The VMware Virtual Machine (SOAP) sensor displays data on CPU usage, memory, datastores, and the network load.
Monitor the guest operating system on the VMs
You can use standard WMI and SSH sensors to monitor the guest operating system installed on your virtual machine. You’ll get data on active processes and services, datastore loads, and more.
The VMware Datastore (SOAP) sensor keeps an eye on the availability and usage of your data memory. This sensor is especially important if you’ve limited the capacity of each virtual machine or the sum of all VM datastores surpasses the total data storage capacity.
Your VMware vRealize alternative PRTG at a glance – even on the go
Set up PRTG in minutes and use it on almost any mobile device.


Need help making a decision?
You are interested to know if PRTG could be an alternative to your VMware vRealize Operations implementation? Contact us for more information.
![]()
"One of PRTG's greatest strengths is certainly its very good user-friendliness. Beyond that, the ability of the software to group all sources of information in a single point is useful. This is how we connect physical equipment, applications, or our VMware Cloud Director consoles to PRTG. The ease of use is incomparable compared to the free solution that we previously used."
Eric Laurent, Head of Information Systems, LNA Santé
PRTG makes network monitoring as easy as it gets
Custom alerts and data visualization let you quickly identify and prevent all kinds of network issues.
Create innovative solutions with Paessler’s partners
Partnering with innovative vendors, Paessler unleashes synergies to create
new and additional benefits for joined customers.


ScriptRunner
With ScriptRunner, Paessler integrates a powerful event automation platform into PRTG Network Monitor.
More than just a monitoring tool:
Reasons our customers love PRTG


PRTG: The multi-tool for sysadmins
Adapt PRTG individually and dynamically to your needs and rely on a strong API:- HTTP API: Access monitoring data and manipulate monitoring objects via HTTP requests
- Custom sensors: Create your own PRTG sensors for customized monitoring
- Custom notifications: Create your own notifications and send action triggers to external systems
- REST Custom sensor: Monitor almost everything that provides data in XML or JSON format
Still not convinced?
![]()
More than 500,000
sysadmins love PRTG
Paessler PRTG is used by companies of all sizes. Sysadmins love PRTG because it makes their job a whole lot easier.
![]()
Monitor your entire IT infrastructure
Bandwidth, servers, virtual environments, websites, VoIP services – PRTG keeps an eye on your entire network.
![]()
Try Paessler PRTG
for free
Everyone has different monitoring needs. That’s why we let you try PRTG for free.
![]()
Start monitoring your network with PRTG and see how it can make your network more reliable and your job easier.
|
PRTG |
Network Monitoring Software - Version 25.1.104.1961 (April 7th, 2025) |
|
Hosting |
Download for Windows and cloud-based version PRTG Hosted Monitor available |
Languages |
English, German, Spanish, French, Portuguese, Dutch, Russian, Japanese, and Simplified Chinese |
Pricing |
Up to 100 sensors for free (Price List) |
Unified Monitoring |
Network devices, bandwidth, servers, applications, virtual environments, remote systems, IoT, and more |
Supported Vendors & Applications |
|
Discover more monitoring insights and stories

Solutions for all your monitoring needs

Powerful stories from the monitoring world
