Custom alerts and data visualization let you quickly identify and prevent system and performance issues.
Like PRTG, but run a Linux-based or mixed-OS network, and don’t want to work on Windows systems?
Good news for you as a Linux user, then. You can track all your network's performance stats from a single dashboard on your Linux or Unix system. 24 hours a day.
This gives you complete control over your network, saving you time and hassle, and making it easy to spot potential issues before they get serious. The choice is yours!
Although Paessler PRTG is Windows-based software and Windows is still required to install a PRTG core server, you can now use our brand-new multi-platform probe for monitoring your entire IT infrastructure from your Linux operating system.
Just install the multi-platform probe on your Linux server and start managing your PRTG monitoring setup like you’re used to – only without the Windows part.
If you’re content with a different way of visualizing your monitoring and need only limited management functionality, our free PRTG app for desktop might be the right thing for you. With it, you can connect to all your PRTG instances via your Linux system.
Simple to set up and use, our PRTG app for desktop enables you to access several PRTG installations and hosted PRTG instances from a central Linux endpoint.
Diagnose network issues by continuously tracking Linux system performance. Show server capacity, bandwidth usage, CPU load, available hard disk space, and other key metrics in real time. Visualize monitoring data in clear graphs and dashboards to identify problems more easily. Gain the overview you need to troubleshoot Linux storage and performance issues.

Live traffic data graph in PRTG

Device tree view of the complete monitoring setup
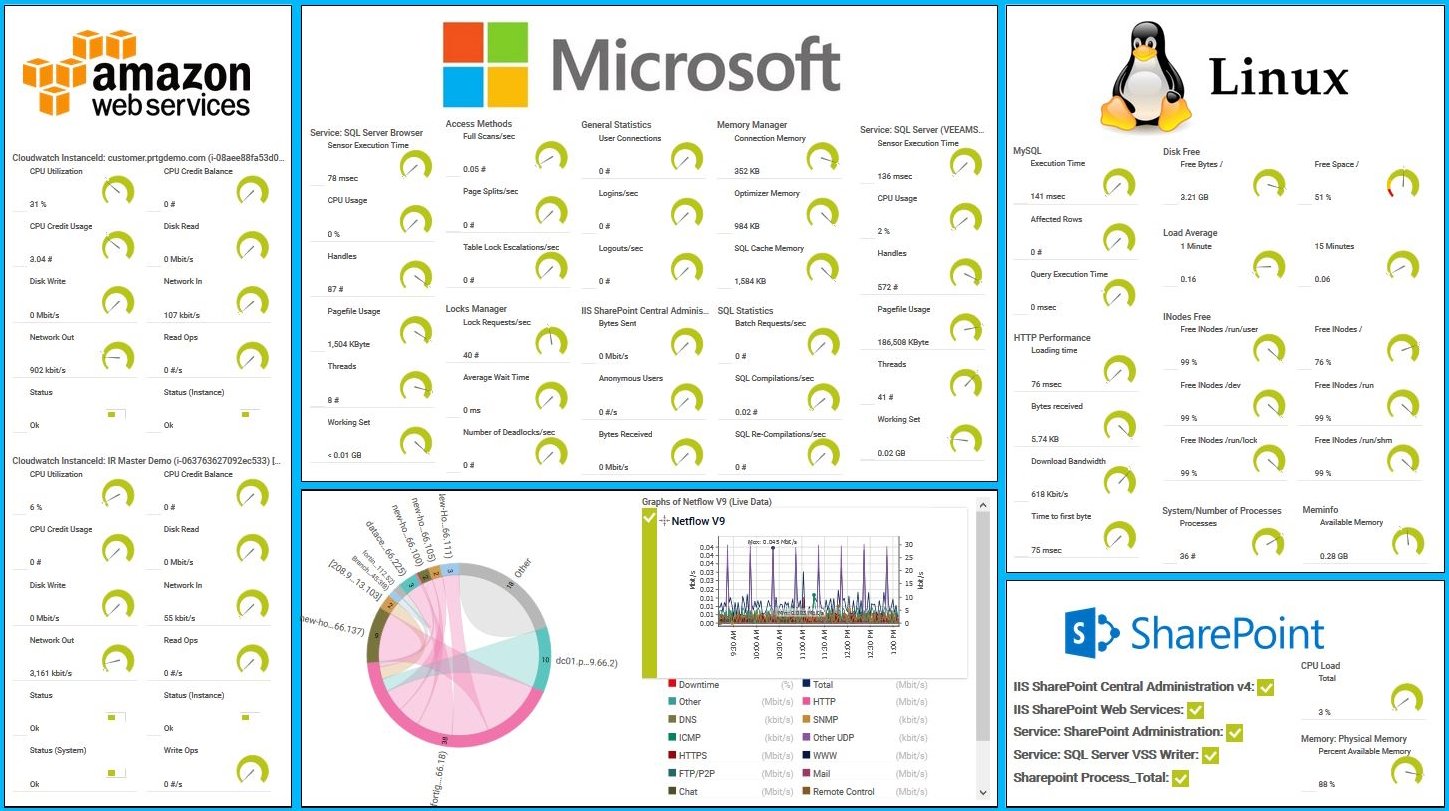
PRTG map with AWS, Linux and Windows services
Live traffic data graph in PRTG
Device tree view of the complete monitoring setup
“All-around winning
network monitor”
“The real beauty of PRTG is the endless possibilities it offers”
“PRTG Network Monitor
is very hard to beat”
Ubuntu. Debian. MX Linux. Linux Mint. Fedora. The multi-platform probe that comes for free with PRTG is compatible with all major Linux distributions, as well as macOS, Solaris, and other Unix-based systems.
Or completely do without our Windows-based, on-prem network monitoring solution and choose our hosted solution PRTG Hosted Monitor for easy access via the web.
Pick your preferred warning and error thresholds and PRTG will let you know the second your network is at risk of going under or exceeding them, so you can fix issues before they cause disruption (and leave the office at a reasonable hour).
We also throw in various notification methods that you can configure according to your needs. Choose, for example, from SMS, email, or MS Teams and Slack message.
A thorough view of your Linux network as well as your entire IT environment, at your fingertips. Whether you just need to check real-time Linux server capacity, or how the average load of all your systems has fluctuated over time, the PRTG app for desktop makes the process quick and easy.
Enjoy easy device tree management, edit multiple monitoring objects at a time, view custom PRTG maps, generate reports, analyze logs – with PRTG on Linux, all from a single pane of glass.
PRTG comes with more than 250 native sensor types for monitoring your entire on-premises, cloud, and hybrid cloud environment out of the box. Check out some examples below!
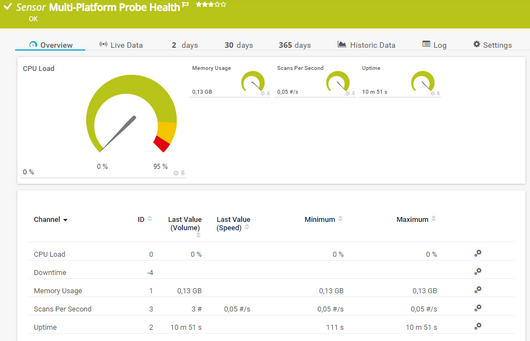
The Multi-Platform Probe Health sensor monitors the status of a multi-platform probe device. It can show the following:
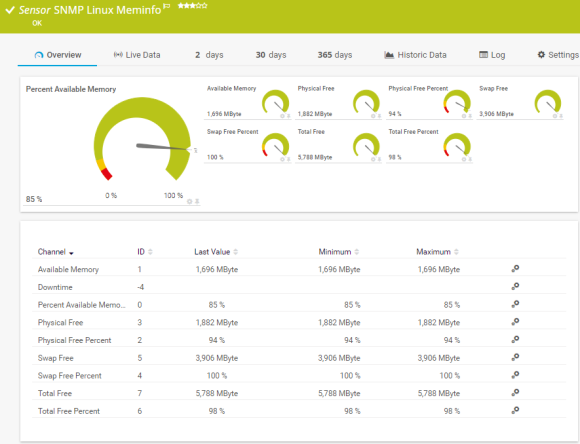
The SNMP Linux Meminfo sensor monitors the memory usage of a Linux/Unix system. It can show the following:
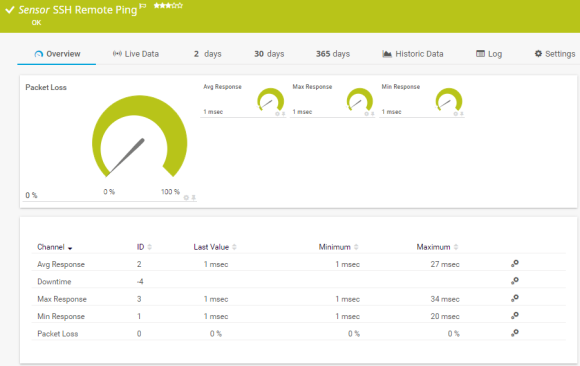
The SSH Remote Ping sensor remotely monitors the connectivity between a system running Linux/macOS X and another device, using Internet Control Message Protocol (ICMP) echo requests ("ping") and Secure Shell (SSH). It can show the following:
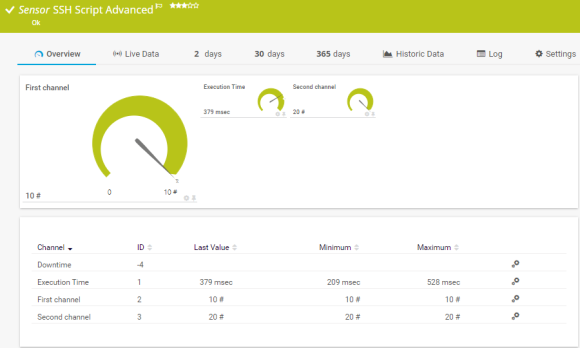
The SSH Script Advanced sensor connects to a Linux/Unix system via Secure Shell (SSH) and executes a script file that is located on the target system. This option is available as part of the PRTG API. It can show the following:
See the PRTG Manual for a list of all available sensor types.

Custom alerts and data visualization let you quickly identify and prevent system and performance issues.
PRTG is set up in a matter of minutes and can be used on a wide variety of mobile devices.

Partnering with innovative IT vendors, Paessler unleashes synergies to create
new and additional benefits for joined customers.

Combining PRTG’s broad monitoring feature set with IP Fabric’s automated network assurance creates a new level of network visibility and reliability.

With ScriptRunner Paessler integrates a powerful event automation platform into PRTG Network Monitor.

UVexplorer integrates tightly with PRTG to bring fast and accurate network discovery, detailed device inventory, and automatic network mapping to the PRTG platform.
Real-time notifications mean faster troubleshooting so that you can act before more serious issues occur.
Network Monitoring Software – Version 24.4.102.1351 (November 12th, 2024)
Download for Windows and cloud-based version PRTG Hosted Monitor available
English, German, Spanish, French, Portuguese, Dutch, Russian, Japanese, and Simplified Chinese
Network devices, bandwidth, servers, applications, virtual environments, remote systems, IoT, and more
Choose the PRTG Network Monitor subscription that's best for you


Yes and no. The central PRTG server can only be installed on a Windows server. But, once you've installed the PRTG server, you can use the brand-new multi-platform probe (a remote probe type in PRTG) that also runs on Linux. With this probe, you can monitor and manage your complete IT infrastructure from your Linux system.
While the PRTG core server installation works best on a dedicated physical computer, you can install it on a virtual machine. If you go this route, we recommend using the fastest processors possible and running not more than 5,000 sensors to maximize performance.
In PRTG, “sensors” are the basic monitoring elements. One sensor usually monitors one measured value in your network, for example the traffic of a switch port, the CPU load of a server, or the free space on a disk drive. On average, you need about 5-10 sensors per device or one sensor per switch port.
Paessler conducted trials in over 600 IT departments worldwide to tune its network monitoring software closer to the needs of sysadmins. The result of the survey: over 95% of the participants would recommend PRTG – or already have.

Paessler PRTG is used by companies of all sizes. Sysadmins love PRTG because it makes their job a whole lot easier.
Bandwidth, servers, virtual environments, websites, VoIP services – PRTG keeps an eye on your entire network.
Everyone has different monitoring needs. That’s why we let you try PRTG for free.