![]()
Windows service monitoring with PRTG
Keep a 24/7 eye on the availability and performance of your Microsoft Windows services
- Ensure your critical Windows services are running smoothly
- Take automated action when your Windows services stop
- Avoid disruption of services to maintain business continuity
Our users give top ratings for monitoring with Paessler PRTG


PRTG Windows service monitoring: What you’ll find on this page

PRTG makes Windows service monitoring as easy as it gets
Custom alerts and data visualization let you quickly identify and prevent interruptions of Windows services and the critical applications that rely on them.
4 reasons to choose PRTG as your Windows service monitoring software
Many critical applications such as Active Directory, SharePoint, and Exchange can only run smoothly if the Windows services they rely on work as expected. If a service stops without you realizing it, there’ll sure as hell be angry end users. Paessler PRTG gives you a comprehensive view of the performance of your Windows services and alerts you in real time if there is an issue so that you can step in and save the day.
Prevent service failures
With PRTG’s easy-to-understand dashboards, you can see at a glance if your Windows services are up and running or if there’s unplanned downtime.
Drill down to the root cause of an issue to fix it quickly, and even prevent disruptions before they happen with custom warning and error thresholds.
Optimize resource allocation
PRTG provides you with valuable metrics on how much resources are being utilized by your Windows services.
This way, you can make informed decisions on capacity planning, allocating more bandwidth and memory to specific Windows servers or buying more hardware.
Stop network security issues
Make sure that suspicious activity like network traffic spikes, unauthorized logins, or hijacked Windows services do not go undetected.
Or set up our network monitoring tool to check for open and closed ports and ensure that malware doesn’t infiltrate your network.
Real-time notifications and alerts
PRTG’s custom alerting lets you set your preferred performance thresholds and choose from various notification methods such as SMS, email, or in-app push notification.
Need more automation? With the possibility to run custom PowerShell scripts, you can also let PRTG restart a Windows service that has stopped unexpectedly.
What Windows service observability looks like in PRTG
Diagnose network issues by continuously tracking the availability and performance of Windows services as well as Windows event logs and other endpoints to detect critical issues. Show uptime, CPU usage, bandwidth utilization, request execution time, and other key metrics in real time. Visualize monitoring data in clear graphs and dashboards to identify problems more easily. Gain the overview you need to troubleshoot service disruptions, authentication issues, and other problems in your network infrastructure.

Device tree view of the complete monitoring setup
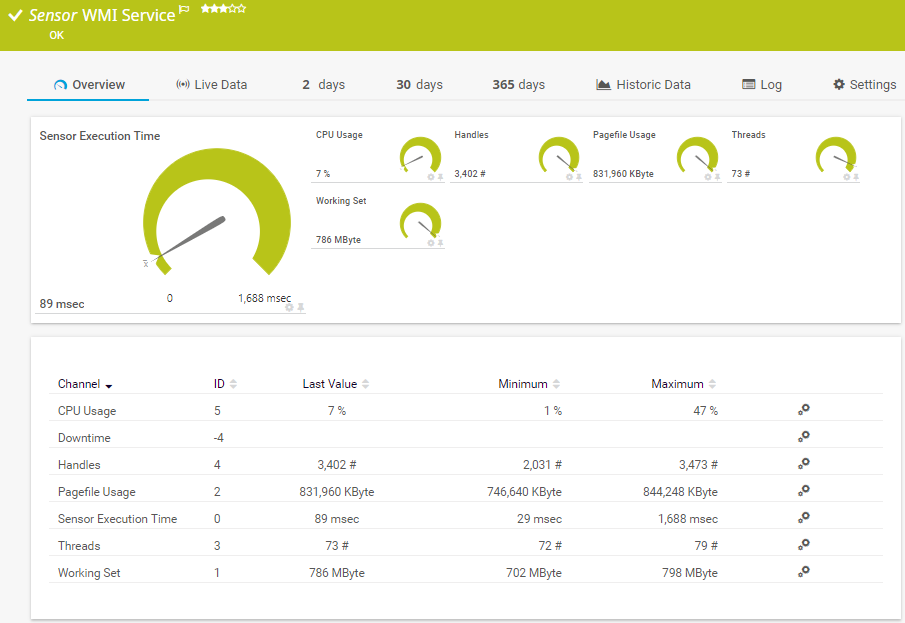
Preconfigured WMI Service sensor in PRTG

Custom PRTG dashboard for keeping an eye on the entire IT infrastructure
Start monitoring Windows services with PRTG and see how it can make your network more reliable and your job easier.
IT experts agree: Paessler PRTG is a great solution for IT infrastructure monitoring

“All-around winning
network monitor”

“The real beauty of PRTG is the endless possibilities it offers”

“PRTG Network Monitor
is very hard to beat”
PRTG makes Windows service monitoring as easy as it gets
Custom alerts and data visualization let you quickly identify and prevent interruptions of Windows services and the critical applications that rely on them.
Your Windows service monitor at a glance – even on the go
Set up PRTG in minutes and use it on almost any mobile device.


Find the root cause of the problem with our PRTG Windows service monitoring solution
Real-time notifications mean faster troubleshooting so that you can act before more serious issues occur.
PRTG is compatible with all major vendors, products, and systems
![]()
Explore our preconfigured PRTG sensors for Windows services monitoring
PRTG comes with more than 250 native sensor types for monitoring your entire on-premises, cloud, and hybrid cloud environment out of the box. Check out some examples below!
Create innovative solutions with Paessler’s partners
Partnering with innovative vendors, Paessler unleashes synergies to create
new and additional benefits for joined customers.


ScriptRunner
With ScriptRunner, Paessler integrates a powerful event automation platform into PRTG Network Monitor.
“Excellent tool for detailed monitoring. Alarms and notifications work greatly. Equipment addition is straight forward and server initial setup is very easy. ...feel safe to purchase it if you intend to monitor a large networking landscape.”
Infrastructure and Operations Engineer in the Communications Industry, firm size 10B - 30B USD
PRTG makes Windows service monitoring as easy as it gets
Custom alerts and data visualization let you quickly identify and prevent interruptions of Windows services and the critical applications that rely on them.

PRTG: The multi-tool for sysadmins
Adapt PRTG individually and dynamically to your needs and rely on a strong API:- HTTP API: Access monitoring data and manipulate monitoring objects via HTTP requests
- Custom sensors: Create your own PRTG sensors for customized monitoring
- Custom notifications: Create your own notifications and send action triggers to external systems
- REST Custom sensor: Monitor almost everything that provides data in XML or JSON format
We asked: would you recommend PRTG?
Over 95% of our customers say yes!
Paessler conducted trials in over 600 IT departments worldwide to tune its network monitoring software closer to the needs of sysadmins.
The result of the survey: over 95% of the participants would recommend PRTG – or already have.

Still not convinced?
![]()
More than 500,000
sysadmins love PRTG
Paessler PRTG is used by companies of all sizes. Sysadmins love PRTG because it makes their job a whole lot easier.
![]()
Monitor your entire IT infrastructure
Bandwidth, servers, virtual environments, websites, VoIP services – PRTG keeps an eye on your entire network.
![]()
Try Paessler PRTG
for free
Everyone has different monitoring needs. That’s why we let you try PRTG for free.
![]()
Start monitoring Windows services with PRTG and see how it can make your network more reliable and your job easier.
|
PRTG |
Network Monitoring Software - Version 25.1.104.1961 (April 7th, 2025) |
|
Hosting |
Download for Windows and cloud-based version PRTG Hosted Monitor available |
Languages |
English, German, Spanish, French, Portuguese, Dutch, Russian, Japanese, and Simplified Chinese |
Pricing |
Up to 100 sensors for free (Price List) |
Unified Monitoring |
Network devices, bandwidth, servers, applications, virtual environments, remote systems, IoT, and more |
Supported Vendors & Applications |
|
Discover more monitoring insights and stories

Solutions for all your monitoring needs

Powerful stories from the monitoring world

Combining the broad monitoring feature set of PRTG with IP Fabric’s automated network assurance creates a new level of network visibility and reliability.