Firewall analyzer with PRTG
Centrally monitor and analyze firewalls and logs, as well as your entire network
- Monitor the status & health of your firewalls 24/7
- Easy setup with preconfigured firewall monitoring sensors
- Get fast alerts of firewall malfunctions and errors
PRTG firewall analyzer: What you’ll find on this page
PRTG makes firewall management monitoring as easy as it gets
Custom alerts and data visualization let you quickly identify downtime of your firewalls and prevent cybersecurity threats.
5 reasons to choose PRTG as your firewall analysis tool
Higher compatibility
Paessler PRTG includes preconfigured monitoring sensors for out-of-the-box compatibility with Cisco, Juniper, SonicWall, Sophos, Fortinet, Barracuda, Palo Alto, and many others. In fact, you can monitor practically any SNMP-compatible firewall device with our SNMP sensors.
So no matter if you need to check the availability, health, or performance of your firewalls, or get automated log analysis, PRTG has got you covered.
Easier maintenance
An outdated firewall might as well be a dead firewall. PRTG can help you with update monitoring, which helps you ensure that your firewall is running with the latest patches. The same goes for firewall hardware that might be too old to work properly.
With PRTG, you can easily keep an eye on the health of your hardware and make sure that you react before a firewall goes down completely.
Better observability
With PRTG, you get one central monitoring tool for your firewalls, servers, routers, switches, applications, services, and more. PRTG monitors your entire network and displays it in easy-to-read dashboards.
Plus, our user interfaces for web, desktop, or mobile phone make it easy to view and analyze collected monitoring data any way you like.
Automated reporting
No need to tremble in the face of upcoming security audits or regulatory compliance audits. PRTG keeps a continuous eye on network security, alerting you the moment there are unauthorized firewall configuration changes or suspicious network traffic that might indicate a security breach.
With PRTG’s customizable, automated reporting functionality, you can easily generate compliance reports or other security reporting at different levels of detail.
Saves time & money
Install and set up PRTG in minutes with our automatic network discovery as well as preconfigured PRTG sensors and device templates for easier integration of devices, applications & more.
You not only save time and effort, but also money: there is no need to invest in many monitoring tools from multiple vendors when you can do it all with our firewall analyzer PRTG.
What firewall analysis looks like in PRTG
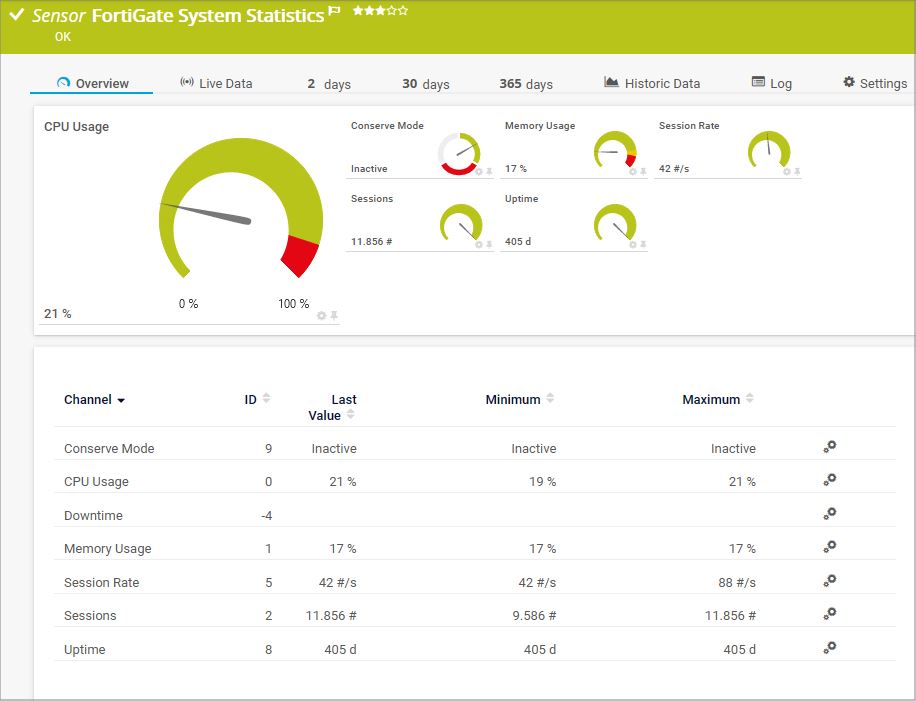
Diagnose network issues by continuously tracking and analyzing firewall devices and logs. Show firewall traffic, CPU and memory usage, uptime, bandwidth monitoring stats, user authentication info, firewall changes, and other key metrics in real time. Visualize monitoring data in clear graphs and dashboards to identify problems more easily. Gain the overview you need to troubleshoot all kinds of issues with firewall security and network performance.
Start analyzing your firewall devices with PRTG and see how it can make your network more reliable and your job easier.
Enjoy industry-leading compatibility with the PRTG
Comprehensive firewall traffic analysis
PRTG includes native sensors for NetFlow, sFlow, and jFlow to get detailed information about the traffic on your firewalls – sorted by IP address, port, and protocol.
But even if your device does not support flow monitoring, PRTG includes the SNMP Traffic v2 sensor and the Packet Sniffer sensor to get the information you need.
Out-of-the-box FortiGate monitoring
Our two built-in sensors for monitoring FortiGate firewalls include the FortiGate VPN Overview sensor, which helps you track your SNMP Cisco ASA VPN Connections.
The FortiGate System Statistics sensor can, for example, determine if the device is in "conserve" mode, a self-protection measure that is activated when the system detects memory shortage.
Built-in SonicWall monitoring
PRTG also comes with two built-in sensors for monitoring SonicWall devices. The SNMP SonicWall System Health sensor helps you keep an eye on the overall health of your firewall.
The SNMP SonicWall VPN Traffic sensor gives you an overview of the IPsec VPN traffic on your SonicWall device such as the number of encrypted and decrypted packets per second.
Real-time alerts and notifications
PRTG notifies you immediately if your firewall is down so you can quickly determine the cause of the interruption and how to get the firewall back up.
You can also customize alerts for different escalation scenarios. Define granular notification triggers, and choose to be notified via email, SMS, push notification, Teams message, and more.
Your firewall log analyzer at a glance – even on the go
Set up PRTG in minutes and use it on almost any mobile device.


Find the root cause of the problem with our PRTG firewall analyzer software
Real-time notifications mean faster troubleshooting so that you can act before more serious issues occur.
PRTG is compatible with all major vendors, products, and systems
Explore our preconfigured PRTG sensors for firewall monitoring
PRTG comes with more than 250 native sensor types for monitoring your entire on-premises, cloud, and hybrid cloud environment out of the box. Check out some examples below!
Create innovative solutions with Paessler’s partners
Partnering with innovative vendors, Paessler unleashes synergies to create
new and additional benefits for joined customers.
“Excellent tool for detailed monitoring. Alarms and notifications work greatly. Equipment addition is straight forward and server initial setup is very easy. ...feel safe to purchase it if you intend to monitor a large networking landscape.”
Infrastructure and Operations Engineer in the Communications Industry, firm size 10B - 30B USD
PRTG makes firewall management monitoring as easy as it gets
Custom alerts and data visualization let you quickly identify downtime of your firewalls and prevent cybersecurity threats.

PRTG: The multi-tool for sysadmins
Adapt PRTG individually and dynamically to your needs and rely on a strong API:- HTTP API: Access monitoring data and manipulate monitoring objects via HTTP requests
- Custom sensors: Create your own PRTG sensors for customized monitoring
- Custom notifications: Create your own notifications and send action triggers to external systems
- REST Custom sensor: Monitor almost everything that provides data in XML or JSON format
We asked: would you recommend PRTG?
Over 95% of our customers say yes!
Paessler conducted trials in over 600 IT departments worldwide to tune its network monitoring software closer to the needs of sysadmins.
The result of the survey: over 95% of the participants would recommend PRTG – or already have.
Still not convinced?
More than 500,000
sysadmins love PRTG
Paessler PRTG is used by companies of all sizes. Sysadmins love PRTG because it makes their job a whole lot easier.
Monitor your entire IT infrastructure
Bandwidth, servers, virtual environments, websites, VoIP services – PRTG keeps an eye on your entire network.
Try Paessler PRTG
for free
Everyone has different monitoring needs. That’s why we let you try PRTG for free.
Start analyzing your firewall devices with PRTG and see how it can make your network more reliable and your job easier.
|
PRTG |
Network Monitoring Software - Version 25.1.104.1961 (April 7th, 2025) |
|
Hosting |
Download for Windows and cloud-based version PRTG Hosted Monitor available |
Languages |
English, German, Spanish, French, Portuguese, Dutch, Russian, Japanese, and Simplified Chinese |
Pricing |
Up to 100 sensors for free (Price List) |
Unified Monitoring |
Network devices, bandwidth, servers, applications, virtual environments, remote systems, IoT, and more |
Supported Vendors & Applications |
|


