Custom alerts and data visualization let you quickly identify and prevent SNMP trap issues.
The Paessler PRTG SNMP Trap Receiver sensor gives you all the information you need to make sense of what is going on in your network:
For more details on how to set up SNMP trap monitoring and how it works with PRTG, watch our tutorial video below.
Paessler PRTG network monitoring can collect all SNMP trap messages that are sent in your network, giving you a central overview of everything. Filter the traps by date, source, agents, and more to analyze your trap messages quickly and easily.
Define SNMP trap messages that represent critical events in your network and configure PRTG to trigger alerts when they occur. You can choose between several notification methods. This way, your IT teams know immediately when issues arise.
With the preconfigured SNMP Trap Receiver sensor in PRTG, it’s fast and easy to start monitoring your SNMP trap messages. Just configure the target device so it can send SNMP traps, then add the sensor in PRTG and define the filters you need.
You can decide if you want to receive all SNMP trap messages generated in your network, or if you want to only receive certain message types or messages from specific devices. This helps you reduce alert noise and focus on what really matters.
Diagnose network issues by continuously tracking SNMP trap messages. Show the status of SNMP traps and other key metrics in real time. Visualize monitoring data in clear graphs and dashboards to identify problems more easily. Gain the overview you need to troubleshoot critical events communicated by SNMP trap messages.

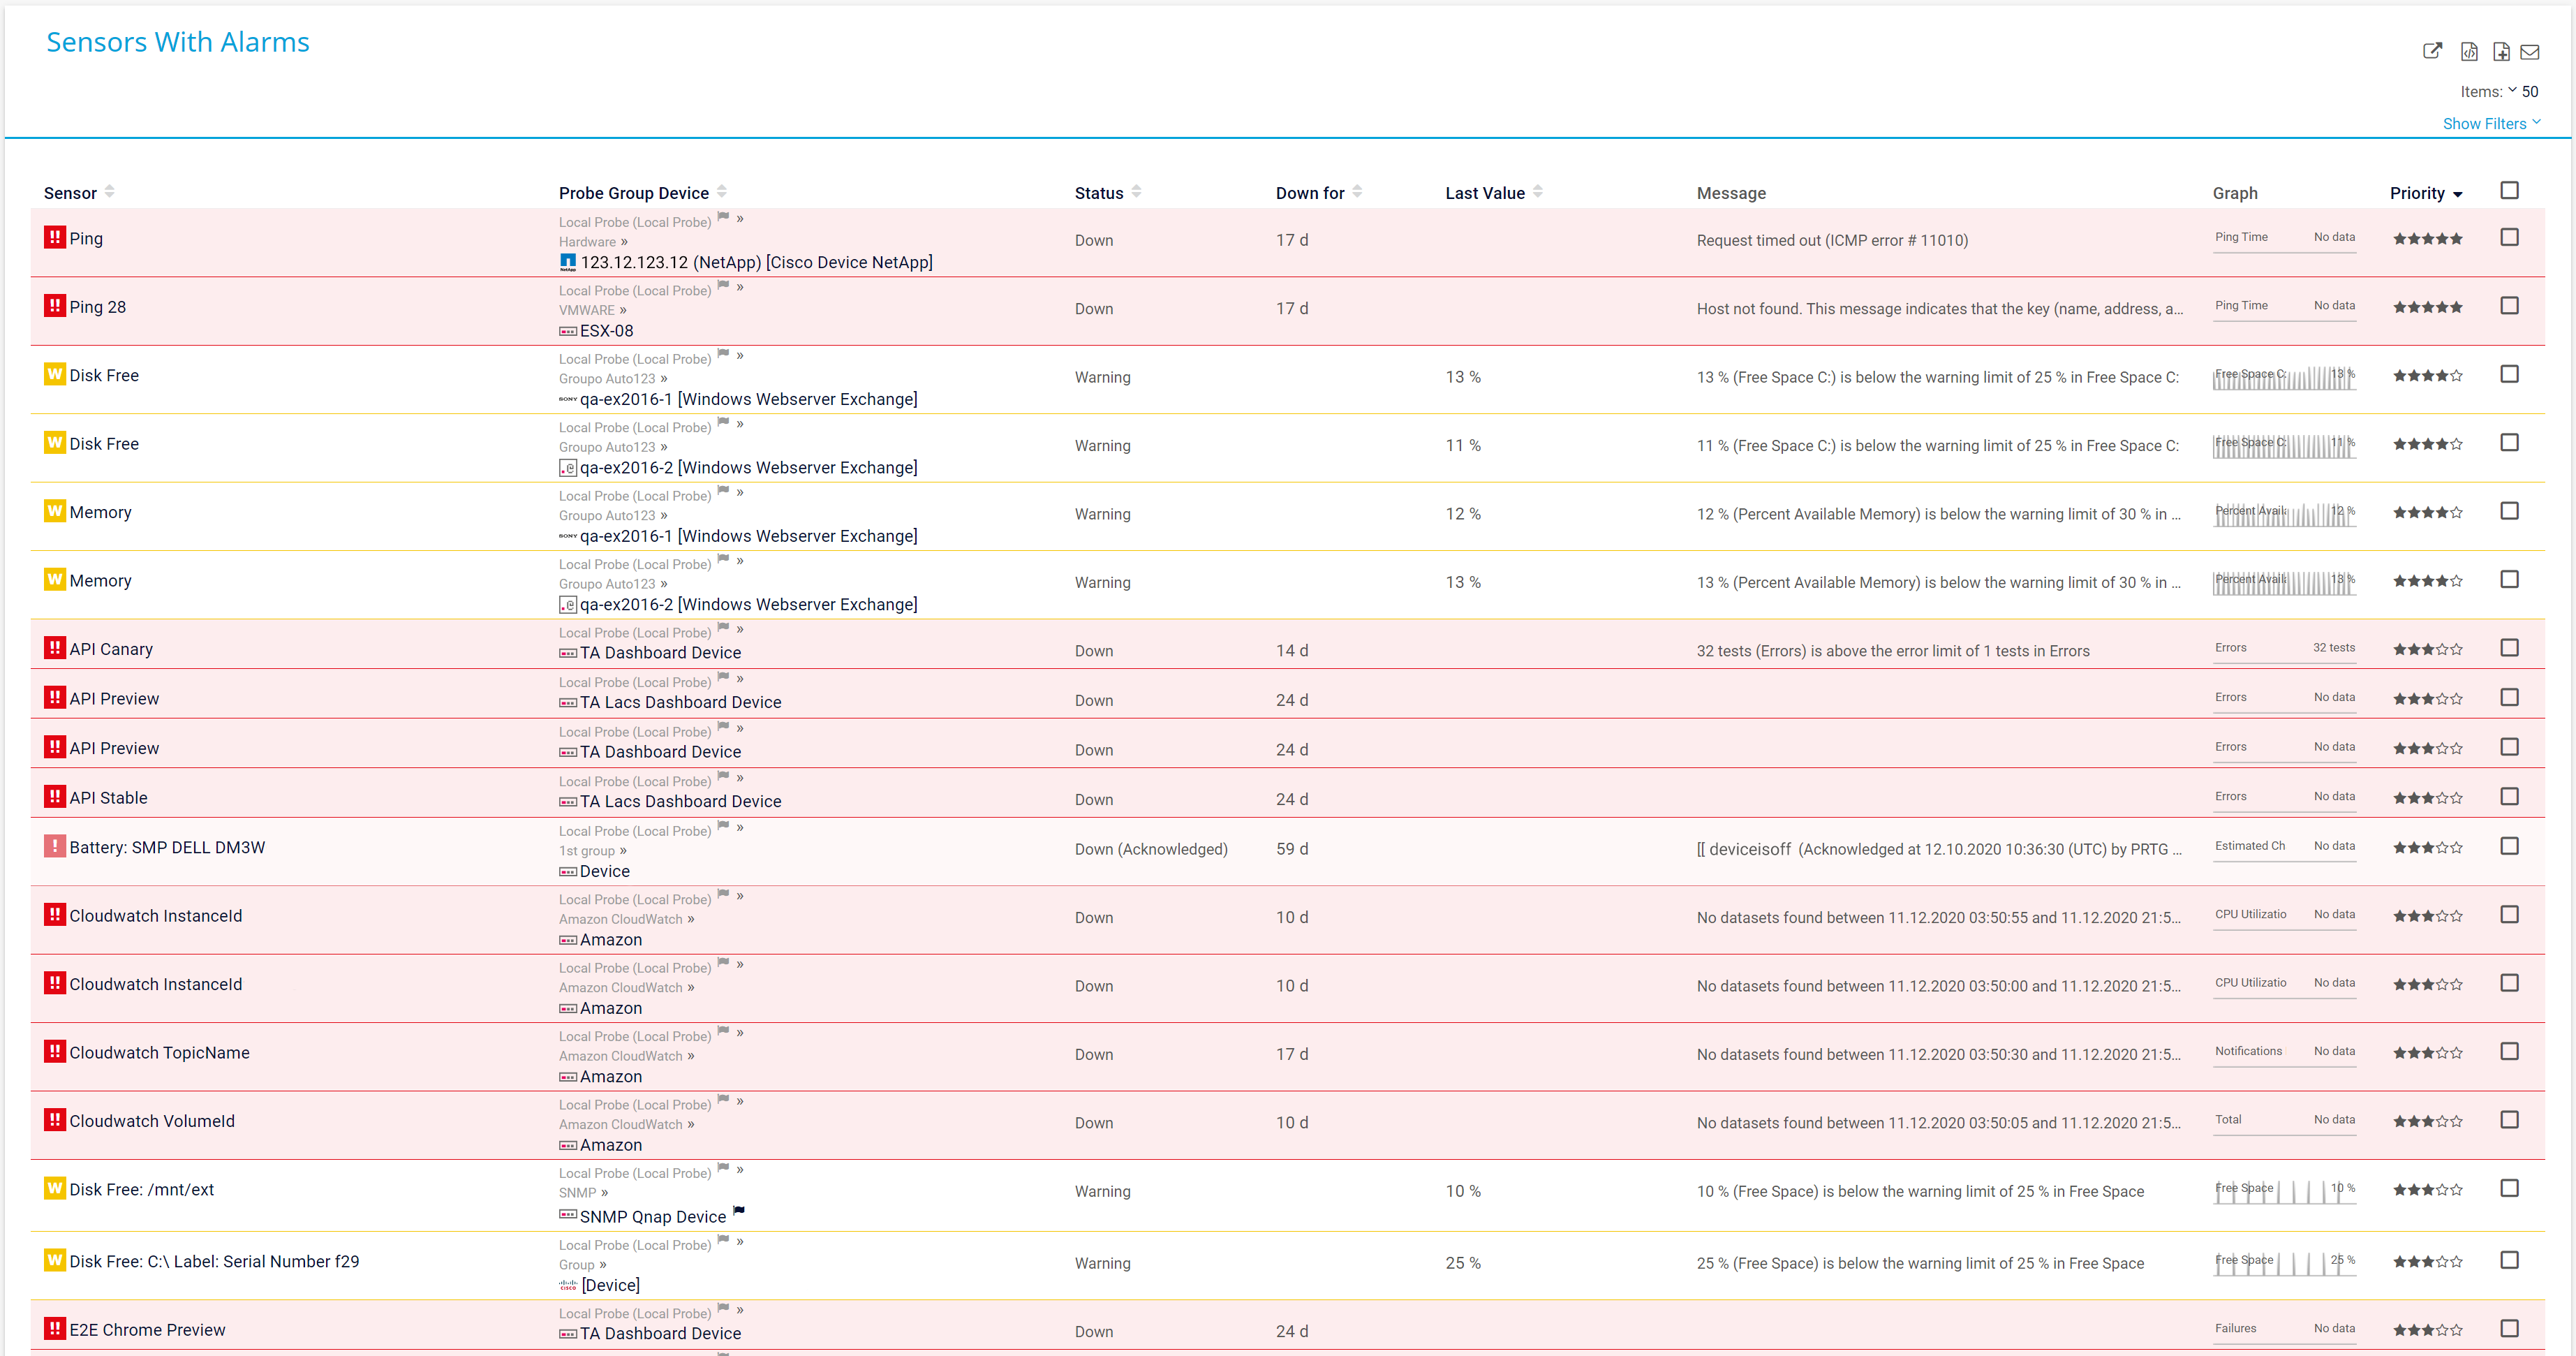
Alarm overview in PRTG

Device tree view of the complete monitoring setup

Custom PRTG dashboard for keeping an eye on the entire IT infrastructure

Alarm overview in PRTG

Device tree view of the complete monitoring setup
With PRTG, you can not only receive and analyze SNMP traps, but also syslog messages. Use PRTG as a kind of syslog server to collect all syslog messages sent from your system, and filter them according to granular rules to only be alerted to issues that matter.
Find out which applications and servers are putting the greatest strain on your network’s bandwidth. Monitor systems, devices, and applications and analyze your network traffic in detail using technologies like SNMP, packet sniffing, or flow protocols (NetFlow, jFlow, sFlow, IPFIX).
PRTG comes with more than 250 native sensor types for monitoring your entire on-premises, cloud, and hybrid cloud environment out of the box. Check out some examples below!
See the PRTG Manual for a list of all available sensor types.
Custom alerts and data visualization let you quickly identify and prevent SNMP trap issues.
PRTG is set up in a matter of minutes and can be used on a wide variety of mobile devices.

“Great interface, intuitive, full REST support. custom scripts, rest sensors add extra value. We have been using PRTG for 10 years now in multiple environments and use cases. it has by far the best interface and very easy to setup without prior experience.”
Partnering with innovative IT vendors, Paessler unleashes synergies to create
new and additional benefits for joined customers.

Combining PRTG’s broad monitoring feature set with IP Fabric’s automated network assurance creates a new level of network visibility and reliability.

By integrating PRTG with Martello iQ, you can add a fast analytics layer to improve uptime, visualize your IT environment, and integrate all of your IT systems into a single pane of glass.

With ScriptRunner Paessler integrates a powerful event automation platform into PRTG Network Monitor.
Real-time notifications mean faster troubleshooting so that you can act before more serious issues occur.
Network Monitoring Software – Version 24.4.102.1351 (November 12th, 2024)
Download for Windows and cloud-based version PRTG Hosted Monitor available
English, German, Spanish, French, Portuguese, Dutch, Russian, Japanese, and Simplified Chinese
Network devices, bandwidth, servers, applications, virtual environments, remote systems, IoT, and more
Choose the PRTG Network Monitor subscription that's best for you


SNMP traps are one of the oldest standards for network equipment fault notification, and most network devices with basic management capabilities support SNMP traps. When a device detects an error or a change, the device sends a notification to one or more trap receivers.
SNMP packets consist of a packet header, a PDU header, and a PDU body. For trap messages, the information sent in the PDU header can vary. The PDU header of an SNMP trap packet contains the packet types, the OID of the device, the IP address of the sender, general and company-specific IDs, and the time the trap event occurred. The actual values are sent in the PDU body.
The SNMP protocol (Simple Network Management Protocol) is a standard protocol used to manage and monitor network devices such as routers, switches, servers, firewalls, and other hardware connected to a network. SNMP allows network administrators to remotely monitor device performance, collect and analyze data, and even modify configurations on these devices to ensure the network runs smoothly and efficiently.
Key components of SNMP include:
Versions of SNMP:
There are three major versions of SNMP, each offering different levels of security and functionality.
The term “trap server” is sometimes used synonymously with “trap receiver.” This server receives and processes messages. Our preconfigured sensor for monitoring SNMP traps lets you configure any PRTG probe device as an SNMP trap server. PRTG supports SNMP v1 traps as defined in RFC 1157, and SNMP v2c traps as outlined in RFC 3416.
PRTG receives the traps, which include the number of messages received per second, warnings, errors, and lost data packets. PRTG presents trap content and messages in an easy-to-read table. Data can be filtered however you like.
With PRTG, you get a quick overview of the traps and their contents, and will be notified immediately in the event of a problem. If you need a more thorough analysis, various specialized tools will allow you to examine traps in detail.
By default, SNMP traps are sent via UDP port 162. This port must be set as the destination port in your source devices.
SNMP works on the assumption that a network management system submits a query, and a managed device returns an answer. There are four possibilities for this exchange: Get, GetNext, Set, and Trap.
With Trap, SNMP traps are automatically sent from a device to a compatible receiver – without the receiver requesting them. This is not the case with Get and GetNext. With these commands, queries are performed manually. Set is no traditional monitoring function.
PRTG has always been developed for Windows systems, which means you can also set up your trap monitoring in Windows.
In PRTG, “sensors” are the basic monitoring elements. One sensor usually monitors one measured value in your network, for example the traffic of a switch port, the CPU load of a server, or the free space on a disk drive. On average, you need about 5-10 sensors per device or one sensor per switch port.
Paessler conducted trials in over 600 IT departments worldwide to tune its network monitoring software closer to the needs of sysadmins. The result of the survey: over 95% of the participants would recommend PRTG – or already have.
Paessler PRTG is used by companies of all sizes. Sysadmins love PRTG because it makes their job a whole lot easier.
Bandwidth, servers, virtual environments, websites, VoIP services – PRTG keeps an eye on your entire network.
Everyone has different monitoring needs. That’s why we let you try PRTG for free.