Custom alerts and data visualization let you quickly identify and prevent system errors and other network security issues.
Is it one of the routers? A firewall? The scanner someone insisted you keep, even though nobody's scanned anything in years? Or any other network device or endpoint?
With hundreds of syslog messages per second even on relatively small networks, tracking down what's causing system errors and spotting network vulnerabilities can feel like trying to unravel a tightly knotted piece of string.
Unless… What if you could zoom in on the root cause of an issue straight away?
Working quietly in the background, Paessler PRTG examines syslog messages (as well as Windows event logs and other log messages) and alerts you the moment something doesn't look right, so you can fix errors and close security loopholes before they do lasting damage.

Fix system and device downtimes with a few clicks. Sort syslog messages by source and threat level and get notified about specific events you define.
For a more in-depth view, PRTG logs all incoming system messages, which you can analyze to easily find the root cause of an issue.
With more than 250 preconfigured sensors for monitoring your IT infrastructure, PRTG syslog analyzer can gather an unparalleled wealth of data in one place.
This makes it easy to keep an eagle eye on your whole network and ensure it stays secure.
Diagnose network issues by continuously tracking system messages and log data. Show the source, severity level, and timestamp of system errors, as well as other key metrics in real time. Visualize monitoring data in clear graphs and dashboards to identify problems more easily. Gain the overview you need to troubleshoot and fix system errors and other network security loopholes.
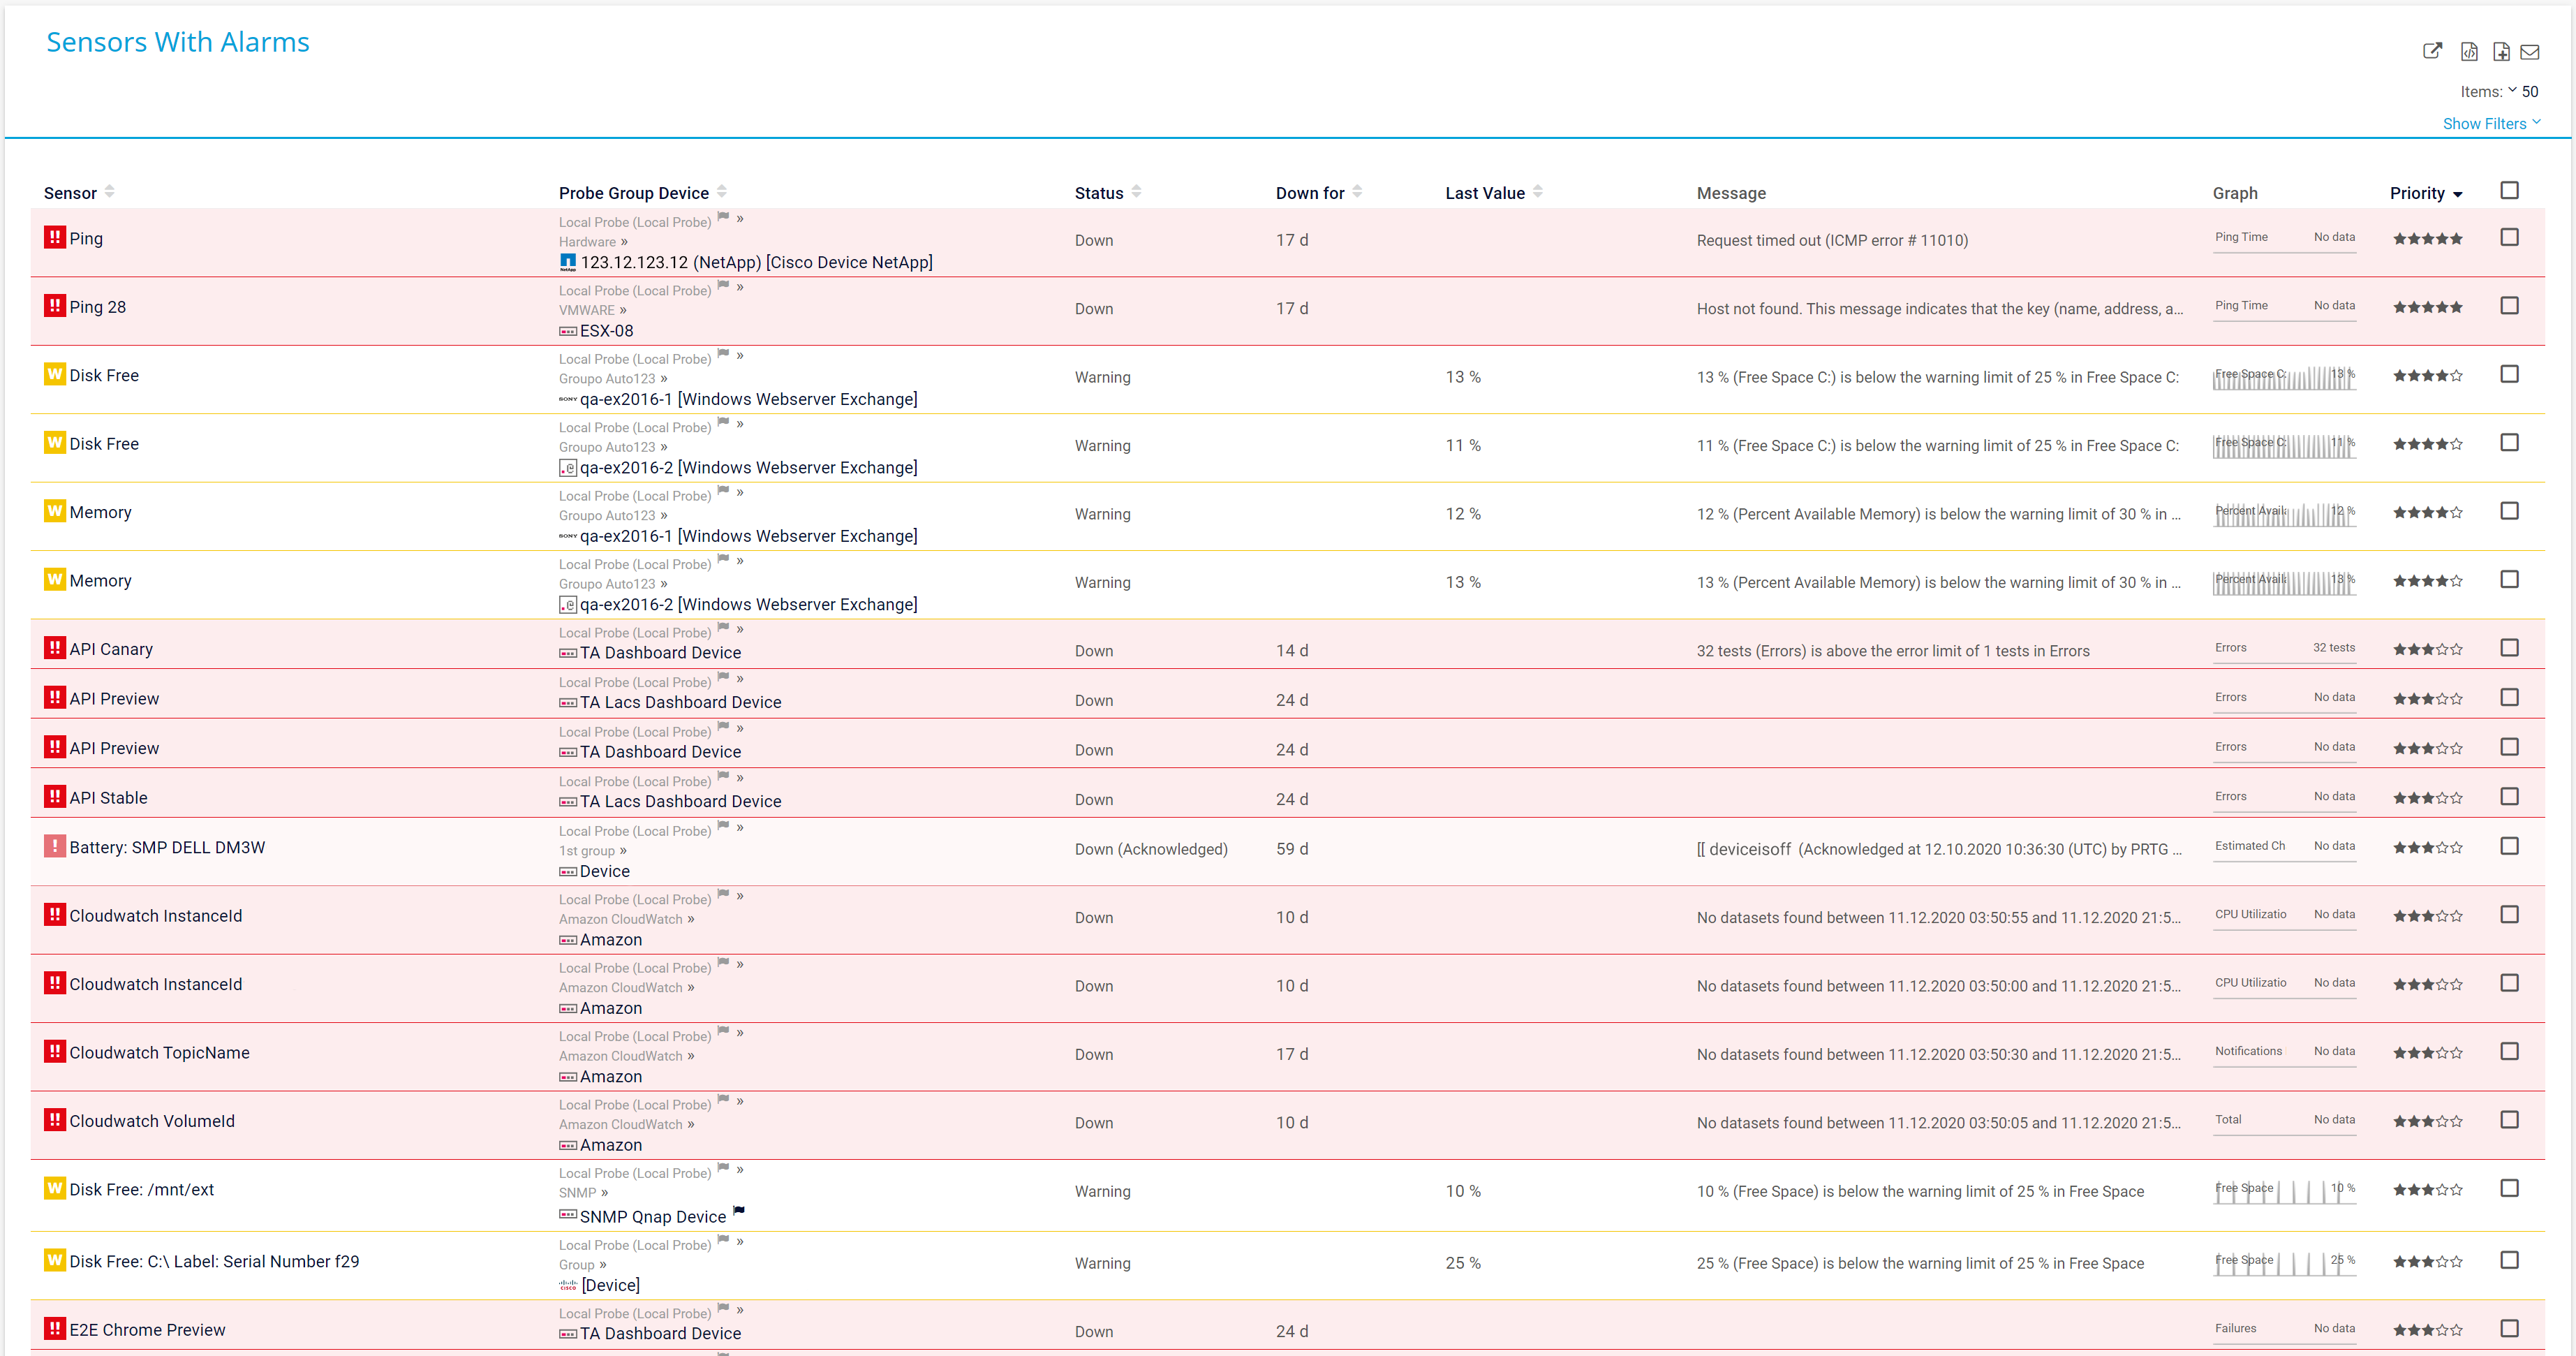
Sensor alarm overview in PRTG

Device tree view of the complete monitoring setup

Custom PRTG dashboard for keeping an eye on the entire IT infrastructure
Sensor alarm overview in PRTG
Device tree view of the complete monitoring setup
“All-around winning
network monitor”
“The real beauty of PRTG is the endless possibilities it offers”
“PRTG Network Monitor
is very hard to beat”
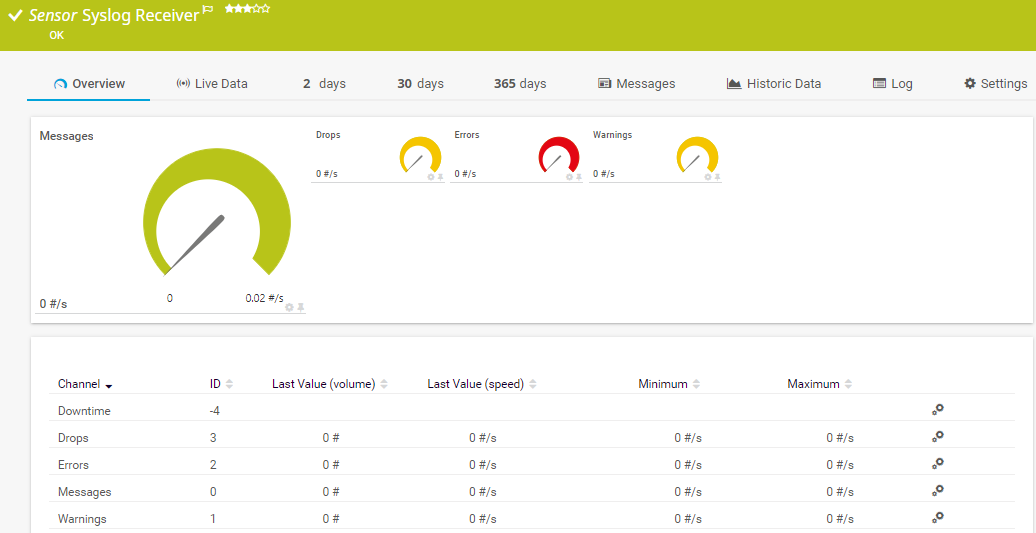
PRTG acts as your central syslog server. Our sophisticated Syslog Receiver sensor gathers and processes system messages and logs from devices across your network, notifying you as soon as there's an error or if specific performance metrics fall below your chosen thresholds. The sensor shows:
It also logs the following data in a list of processed syslog messages:
Combine it with any other of our PRTG sensors – including sensors for monitoring, for example, your VPN, SharePoint server, or backups – to conduct deeper analysis and make your network even more secure.
PRTG comes with more than 250 native sensor types for monitoring your entire on-premises, cloud, and hybrid cloud environment out of the box. Check out some examples below!
The Syslog Receiver sensor receives and analyzes Syslog messages. It can show the following:
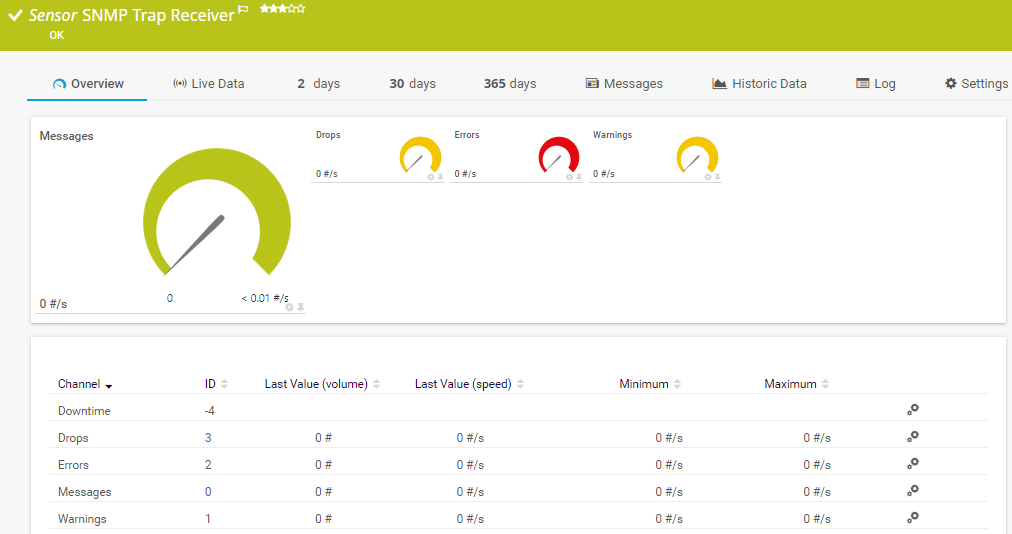
The SNMP Trap Receiver sensor receives and analyzes Simple Network Management Protocol (SNMP) traps. . It can show the following:
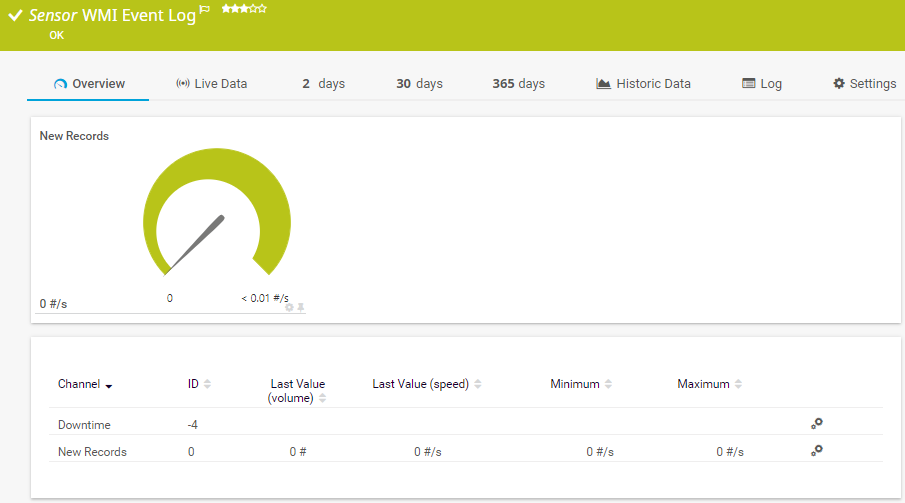
The WMI Event Log sensor monitors a Windows log file. It can show the following:
See the PRTG Manual for a list of all available sensor types.

Custom alerts and data visualization let you quickly identify and prevent system errors and other network security issues.
PRTG is set up in a matter of minutes and can be used on a wide variety of mobile devices.


“Excellent tool for detailed monitoring. Alarms and notifications work greatly. Equipment addition is straight forward and server initial setup is very easy. ...feel safe to purchase it if you intend to monitor a large networking landscape.”
Partnering with innovative IT vendors, Paessler unleashes synergies to create
new and additional benefits for joined customers.
IT that works constitutes a business-critical basis for a company's success. Availability and security must be defined for the respective purpose and closely monitored – by OT and IT alike.
Integrating monitoring results from PRTG into NetBrain maps makes the foundation for network automation.

With ScriptRunner Paessler integrates a powerful event automation platform into PRTG Network Monitor.
Real-time notifications mean faster troubleshooting so that you can act before more serious issues occur.
Network Monitoring Software – Version 24.4.102.1351 (November 12th, 2024)
Download for Windows and cloud-based version PRTG Hosted Monitor available
English, German, Spanish, French, Portuguese, Dutch, Russian, Japanese, and Simplified Chinese
Network devices, bandwidth, servers, applications, virtual environments, remote systems, IoT, and more
Choose the PRTG Network Monitor subscription that's best for you


Syslog stands for System Logging Protocol and is a standard protocol used to send system log or event messages to a specific server, called a syslog server. It is primarily used to collect various device logs from several different machines in a central location for monitoring and review. The protocol is enabled on most network equipment. In addition, syslog is available on Unix- and Linux-based systems and many web servers including Apache.
Yes. PRTG is a proprietary network monitoring tool that also monitors and evaluates system messages and logs in real time. It can receive and analyze syslog messages from routers, printers, scanners, switches, firewalls, and other devices on your network. If it detects errors or unusual activity, it sends you a text, email, or in-app message, so you can fix the issue before it causes serious security issues or network disruption.
Syslog servers are also known as syslog collectors or syslog receivers. Devices that are accordingly configured send syslog messages to the syslog receiver. For example, the IP address of the destination syslog server must be configured on the sending device. There is no mechanism within the syslog protocol that allows a server other than the one you configured to request syslog data.
PRTG can be used as a basic syslog receiver that monitors, collects, and analyzes incoming syslog messages.
There are lots of good reasons to use a syslog analyzer. Having a specialized syslog analyzer means you don't have to retrieve and check syslogs manually. It ensures security risks don't fall through the cracks. And, most importantly, it means you can be proactive, addressing network vulnerabilities before bad actors can exploit them.
In PRTG, “sensors” are the basic monitoring elements. One sensor usually monitors one measured value in your network, for example the traffic of a switch port, the CPU load of a server, or the free space on a disk drive. On average, you need about 5-10 sensors per device or one sensor per switch port.
Paessler conducted trials in over 600 IT departments worldwide to tune its network monitoring software closer to the needs of sysadmins. The result of the survey: over 95% of the participants would recommend PRTG – or already have.

Paessler PRTG is used by companies of all sizes. Sysadmins love PRTG because it makes their job a whole lot easier.
Bandwidth, servers, virtual environments, websites, VoIP services – PRTG keeps an eye on your entire network.
Everyone has different monitoring needs. That’s why we let you try PRTG for free.