Custom alerts and data visualization let you quickly identify and prevent server performance issues.
Paessler PRTG monitors your entire infrastructure & servers, including processors, memory, CPU usage, cooling fans, power supplies, and more.
PRTG alerts ensure that system failures are only short-lived or even prevented.
PRTG simplifies capacity planning to save you time and money.
Diagnose network issues by continuously tracking all your servers and hosts. Show server health and status in real time. Visualize monitoring data in clear graphs and dashboards to identify problems more easily. Gain the overview you need to troubleshoot server issues and prevent problems.

Live traffic data graph in PRTG
PRTG map for hardware monitoring

Device tree view of the complete monitoring setup

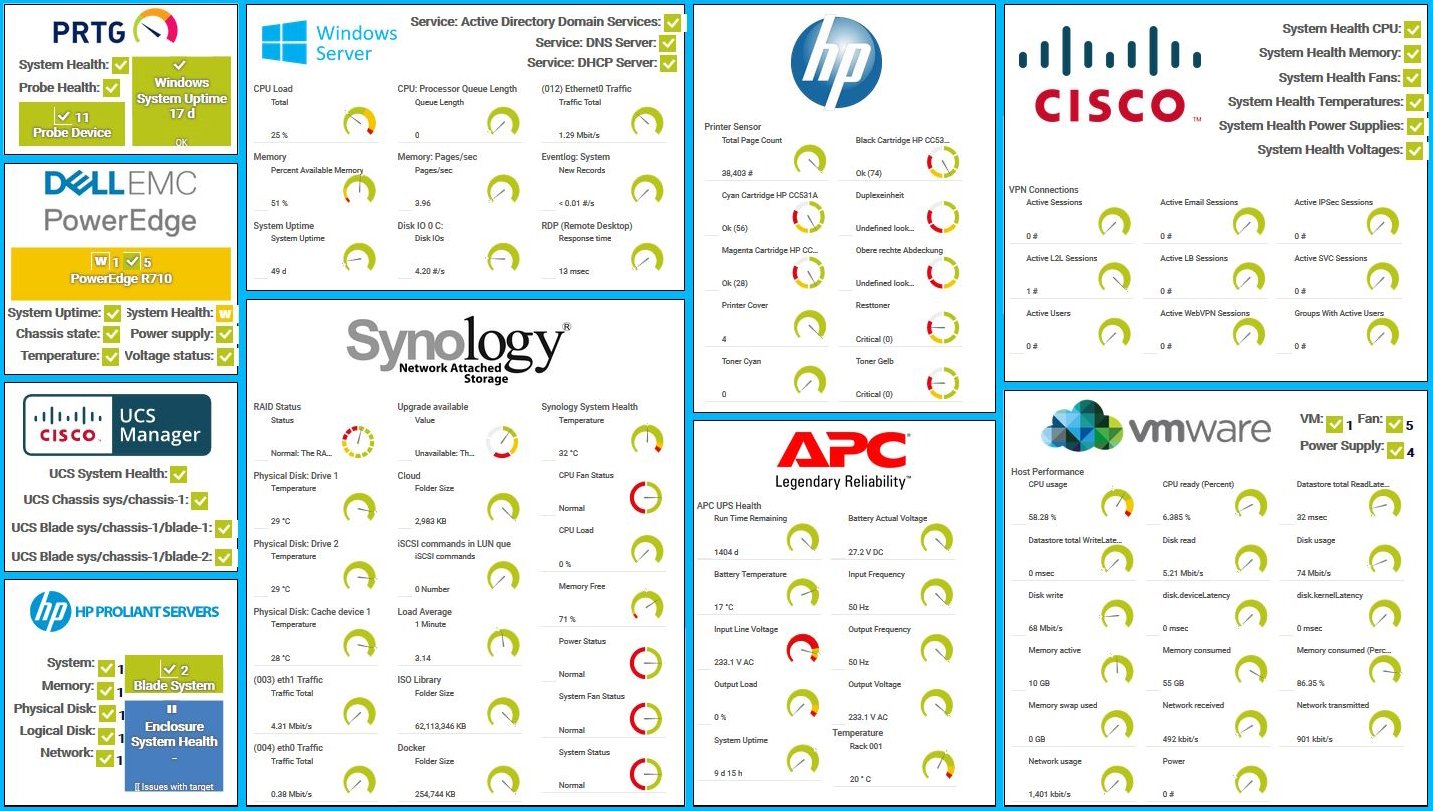
Custom PRTG dashboard for keeping an eye on the entire IT infrastructure
Live traffic data graph in PRTG
PRTG map for hardware monitoring
“All-around winning
network monitor”
“The real beauty of PRTG is the endless possibilities it offers”
“PRTG Network Monitor
is very hard to beat”
Server monitoring lets you monitor your servers in real time with regard to availability, accessibility, capacity, and overall reliability.
Sysadmins monitor their servers because they wish to improve the network performance and stability.
Sysadmins analyze the values they receive from their monitoring software to develop courses of action.
PRTG monitors all types of servers – even in distributed networks. Here are a few examples of the kinds of servers for which PRTG provides predefined sensors so that you can start monitoring servers immediately.
PRTG comes with more than 250 native sensor types for monitoring your entire on-premises, cloud, and hybrid cloud environment out of the box. Check out some examples below!
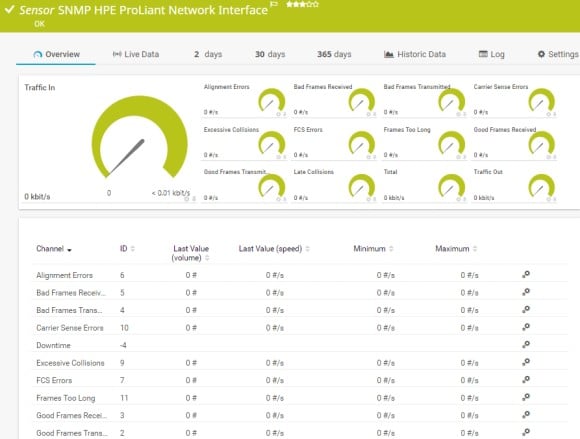
The SNMP HPE ProLiant Network Interface sensor monitors a network interface in an HPE ProLiant server. It can show the following:
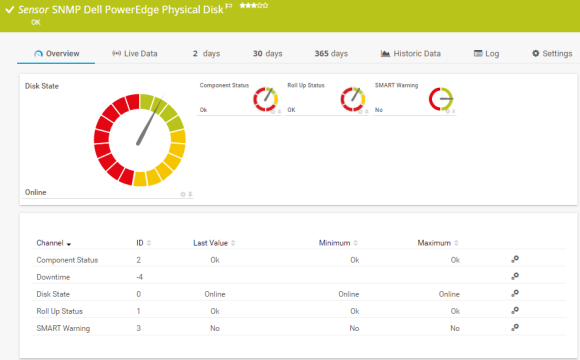
The SNMP Dell PowerEdge Physical Disk sensor monitors a physical disk in a Dell PowerEdge server. It can show the following:
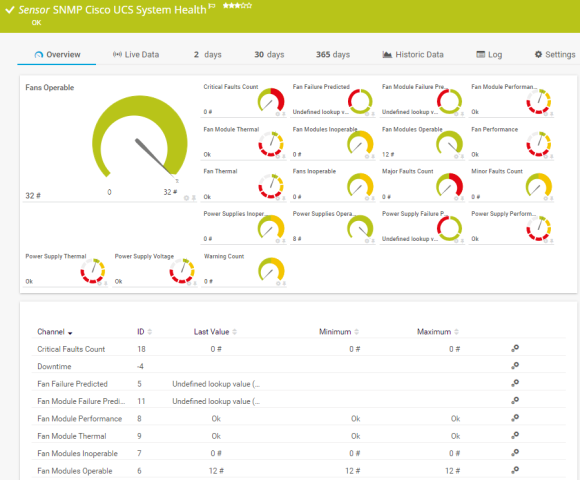
The SNMP Cisco UCS System Health sensor monitors the system health of a Cisco Unified Computing System device. It can show the following:
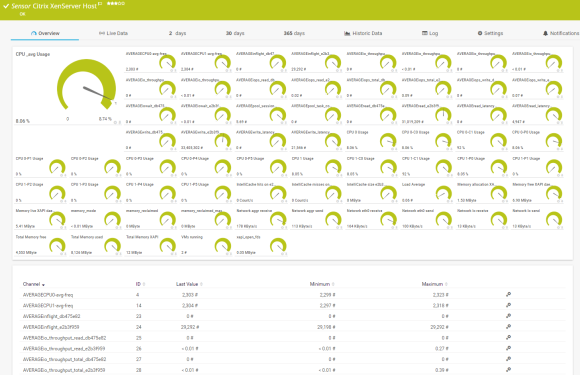
The Citrix XenServer Host sensor monitors a Xen host server via HTTP. It can show the following:
See the PRTG Manual for a list of all available sensor types.
Real-time notifications mean faster troubleshooting so that you can act before more serious issues occur.

Virtualized servers are complex. Malfunctions at the hardware level also affect virtual machines. PRTG gives you a complete overview at all times as a monitoring solution for your entire virtual environment.
Create a foundation that enables your efficient data structures to run as smoothly as possible – and watch as the improved utilization pays off.
PRTG is one of the server monitor tools that can monitor almost any virtual infrastructure including Microsoft Hyper-V, Citrix XenServer, Nutanix, VMware, and more.
As a VMware technology partner, our server monitoring tool offers predefined PRTG VMware sensors for different purposes as well as sensors for many other vendors.
PRTG is fast and easy to upgrade and adapts to your growth dynamically. New sensors can be easily applied in minutes, reducing your time and effort in managing your server monitoring solution. This is particularly important since virtual servers are often introduced when a company is in the midst of vigorous growth.
In virtual environments in particular, it's vital to monitor all your hosts. Host monitoring with PRTG allows you to constantly keep track of the availability and performance of your host (CPU, memory usage, and other performance metrics). Especially if multiple VMs are running on one host, it's absolutely crucial to ensure a proper allocation of resources. Host monitoring can also be important for web servers.
PRTG is set up in a matter of minutes and can be used on a wide variety of mobile devices.

Hewlett Packard Enterprises and Paessler are collaborating in a fresh new way to bring increased value to you as our customer.
What does this mean for you?
Partnering with innovative IT vendors, Paessler unleashes synergies to create
new and additional benefits for joined customers.

With ScriptRunner Paessler integrates a powerful event automation platform into PRTG Network Monitor.

UVexplorer integrates tightly with PRTG to bring fast and accurate network discovery, detailed device inventory, and automatic network mapping to the PRTG platform.

Combining their tools to a powerful solution for advanced analysis and automation, KnowledgeRiver and Paessler enable IT teams to ensure best performance for their infrastructure and networks.
Real-time notifications mean faster troubleshooting so that you can act before more serious issues occur.
Network Monitoring Software – Version 24.4.102.1351 (November 12th, 2024)
Download for Windows and cloud-based version PRTG Hosted Monitor available
English, German, Spanish, French, Portuguese, Dutch, Russian, Japanese, and Simplified Chinese
Network devices, bandwidth, servers, applications, virtual environments, remote systems, IoT, and more
Choose the PRTG Network Monitor subscription that's best for you


PRTG can monitor various types of servers including web servers, SQL servers, file servers, mail servers, and virtual servers across different platforms such as Windows, Linux, and macOS.
Yes, PRTG can monitor servers hosted on cloud platforms such as Amazon AWS, Microsoft Azure, and Google Cloud. This includes virtual machines, cloud storage, and other cloud services.
PRTG can help predict server failures by monitoring trends and performance metrics like CPU load, memory usage, and disk space. If these metrics show unusual patterns, it could indicate a potential issue, allowing administrators to intervene before an actual failure occurs.
Lightweight Directory Access Protocol (LDAP) is a protocol that queries information from ditributed directory services. Directories contain object-related data which monitoring tools like PRTG that support LDAP monitoring can read. One such directory is Active Directory, the Microsoft service created for use in a Windows Server environment.
PRTG comes with a preconfigured LDAP sensor out of the box. This sensor connects to the LDAP server using distinguished name (DN) authentication, and displays the response time of your LDAP server if both connection attempt and authentication are successful.
Yes, it does. HTTP error messages are clear evidence that web server monitoring with PRTG makes sense. All the more so if the website is an important tool for the company.
All status codes that begin with “5” (5XX) are server errors – and therefore a problem. Server error 500 is a collective status code for unexpected server errors. All other server errors (501, 502, 503, etc.) are used to flag specific problems. Error 503, for example, means that the website’s web server is currently overloaded or unavailable. For more information, see our Knowledge Base articles about HTTP status codes and HTTP response codes.
PRTG comes with a full range of HTTP sensors for monitoring websites as well as individual URLs.
In PRTG, “sensors” are the basic monitoring elements. One sensor usually monitors one measured value in your network, for example the traffic of a switch port, the CPU load of a server, or the free space on a disk drive. On average, you need about 5-10 sensors per device or one sensor per switch port.
Paessler conducted trials in over 600 IT departments worldwide to tune its network monitoring software closer to the needs of sysadmins. The result of the survey: over 95% of the participants would recommend PRTG – or already have.

Paessler PRTG is used by companies of all sizes. Sysadmins love PRTG because it makes their job a whole lot easier.
Bandwidth, servers, virtual environments, websites, VoIP services – PRTG keeps an eye on your entire network.
Everyone has different monitoring needs. That’s why we let you try PRTG for free.