Custom alerts and data visualizations let you quickly identify and prevent bottlenecks and other network performance issues.
Network usage has a sweet spot.
Too low, and it might be a sign there's an outage, resource allocation issue, or even a security breach. Too high, and it risks causing packet loss, latency, or overloading the system.
Paessler PRTG's more than 250 preconfigured sensors track all network activity and monitor usage across your whole network. Once you pick your parameters, it works quietly (and tirelessly) in the background, alerting you if usage goes above or below the recommended threshold so you can dial it back to "just right".
Set it and forget it. PRTG monitors your network 24 hours a day, 7 days a week, and alerts you the second something's not working as it should.
That means you can go home relaxed, enjoy the weekend, and unplug completely while on vacation. PRTG gives you real peace of mind, safe in the knowledge your network is in good hands.
Zoom in on what's causing a performance issue…before it becomes an actual problem. PRTG's comprehensive, easy-to-use dashboards put key stats at your fingertips in real time.
You’ll be like an eagle who sees a mouse from hundreds of feet away – and already on the floor tightening the screws on the server before your coworkers have a chance to put down their coffee and call the support line.
All good things come to an end. Even trusted network components. PRTG tracks the health and performance of your routers, switches, and any other devices connected to your network over time, showing you which ones are still going strong, and which ones you should retire.
Your network thus stays fit and trim well into the future – and you can save yourself some wrinkles.
Diagnose network issues by continuously tracking Wi-Fi internet connections, bandwidth utilization, data usage, and more. Show server status, network speed, packet loss, latency, throughput, and other key metrics in real time. Visualize monitoring data in clear graphs and dashboards to identify problems more easily. Gain the overview you need to troubleshoot bandwidth hogs, underperformance, and more.
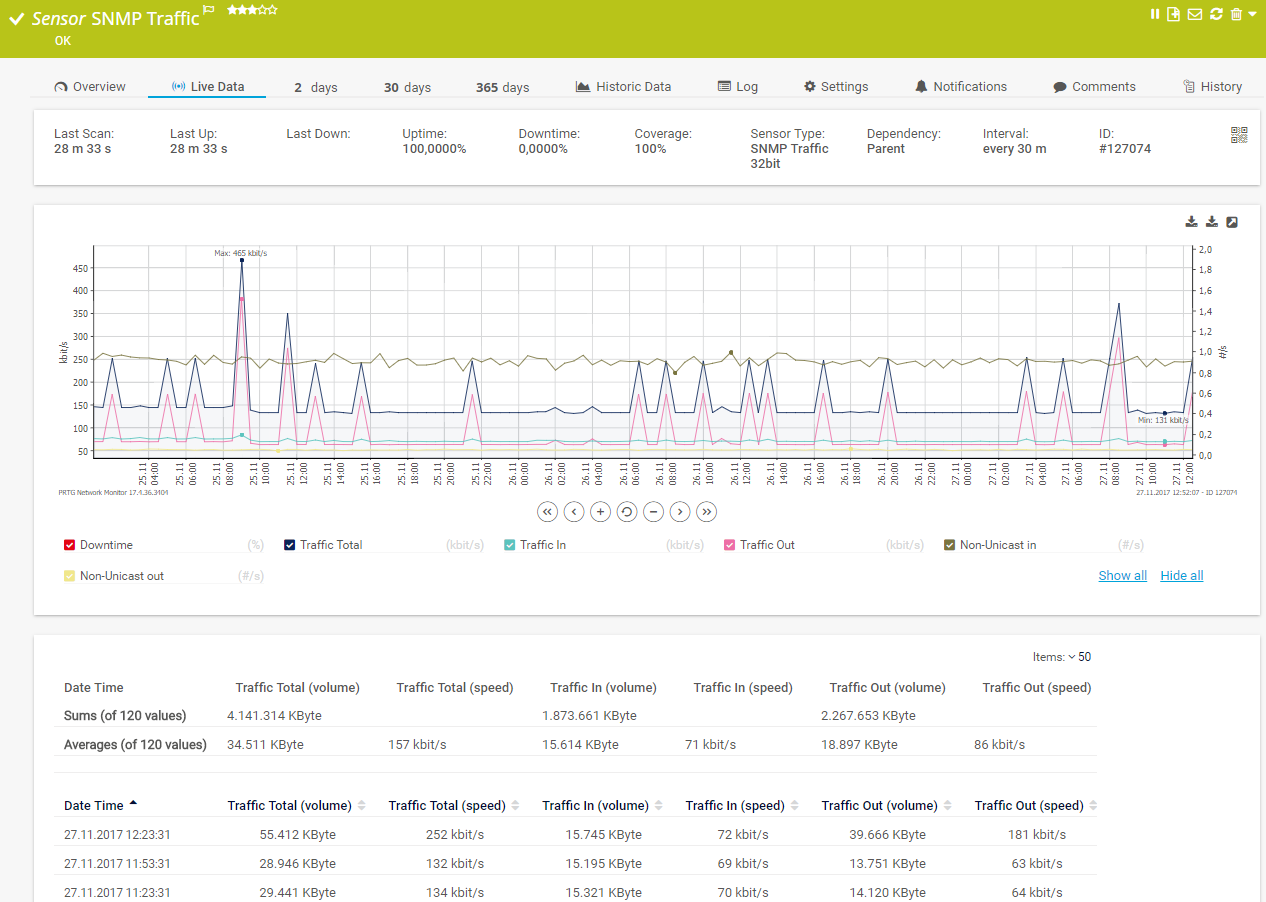
Live traffic data graph in PRTG
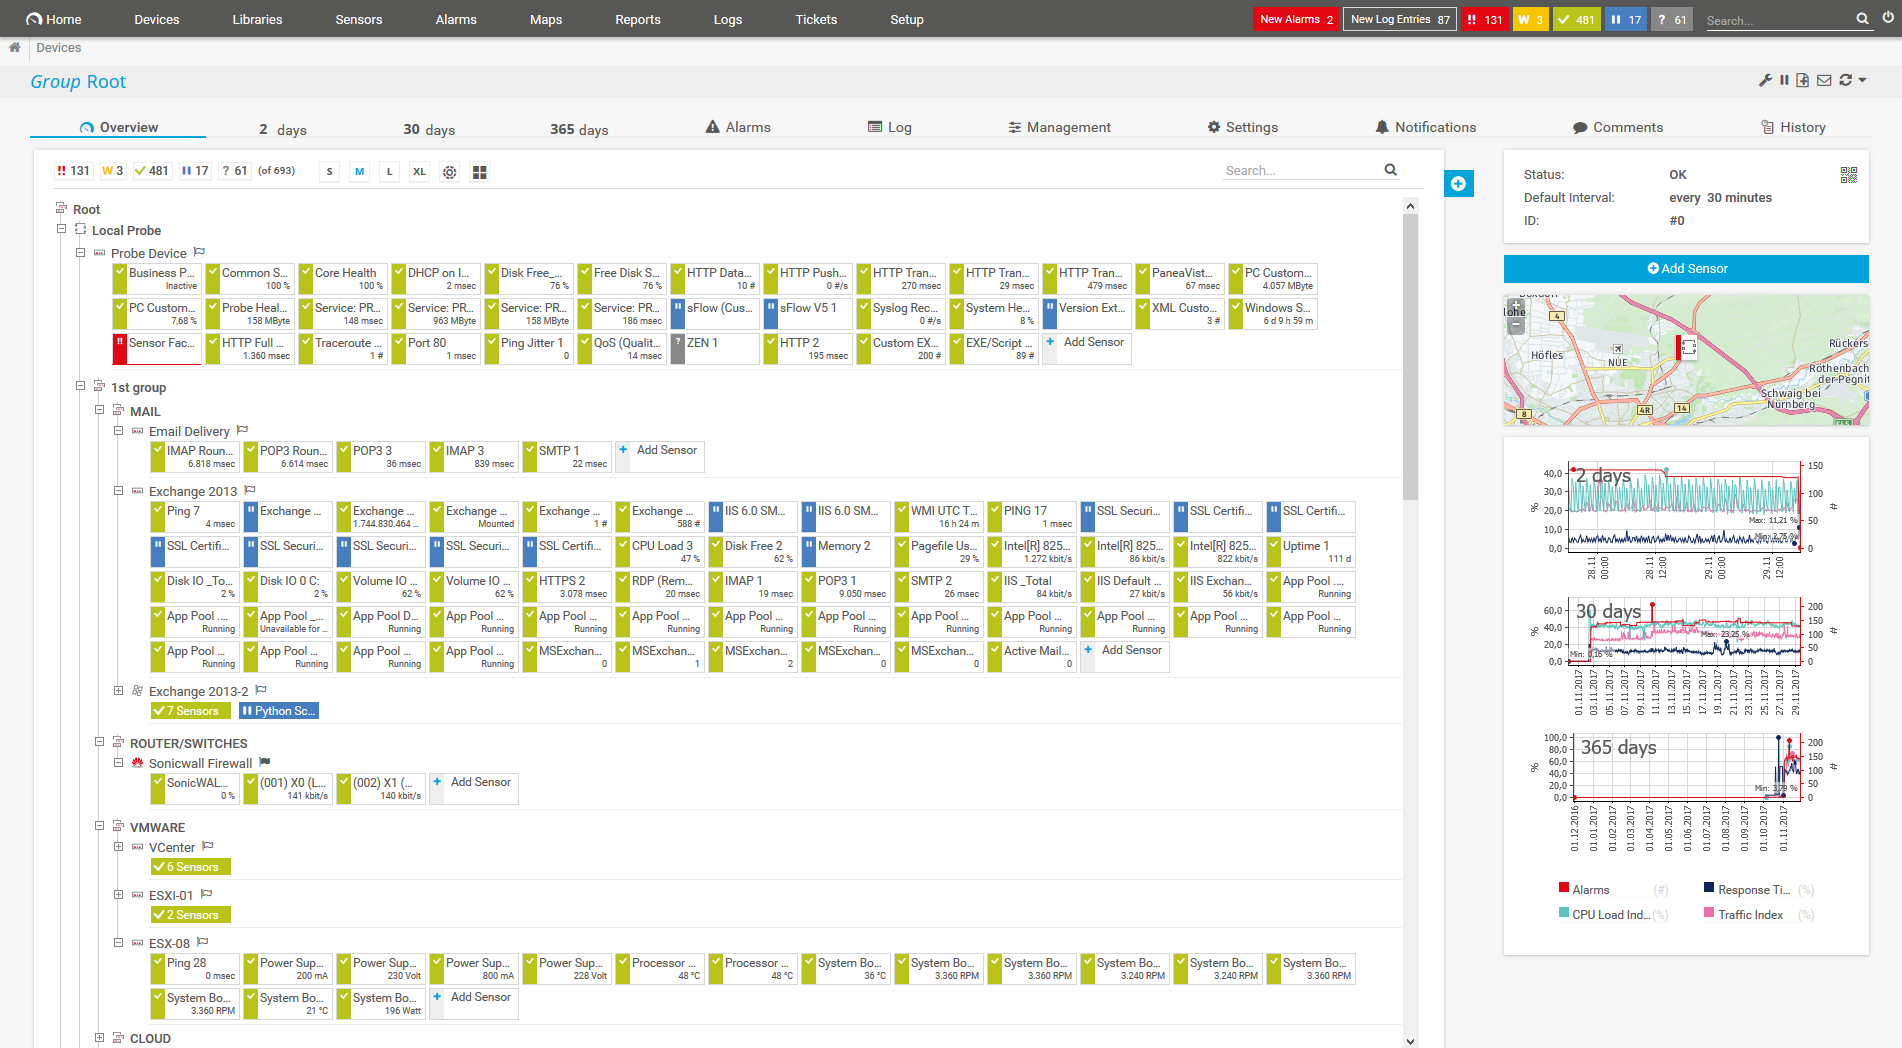
Device tree view of the complete monitoring setup
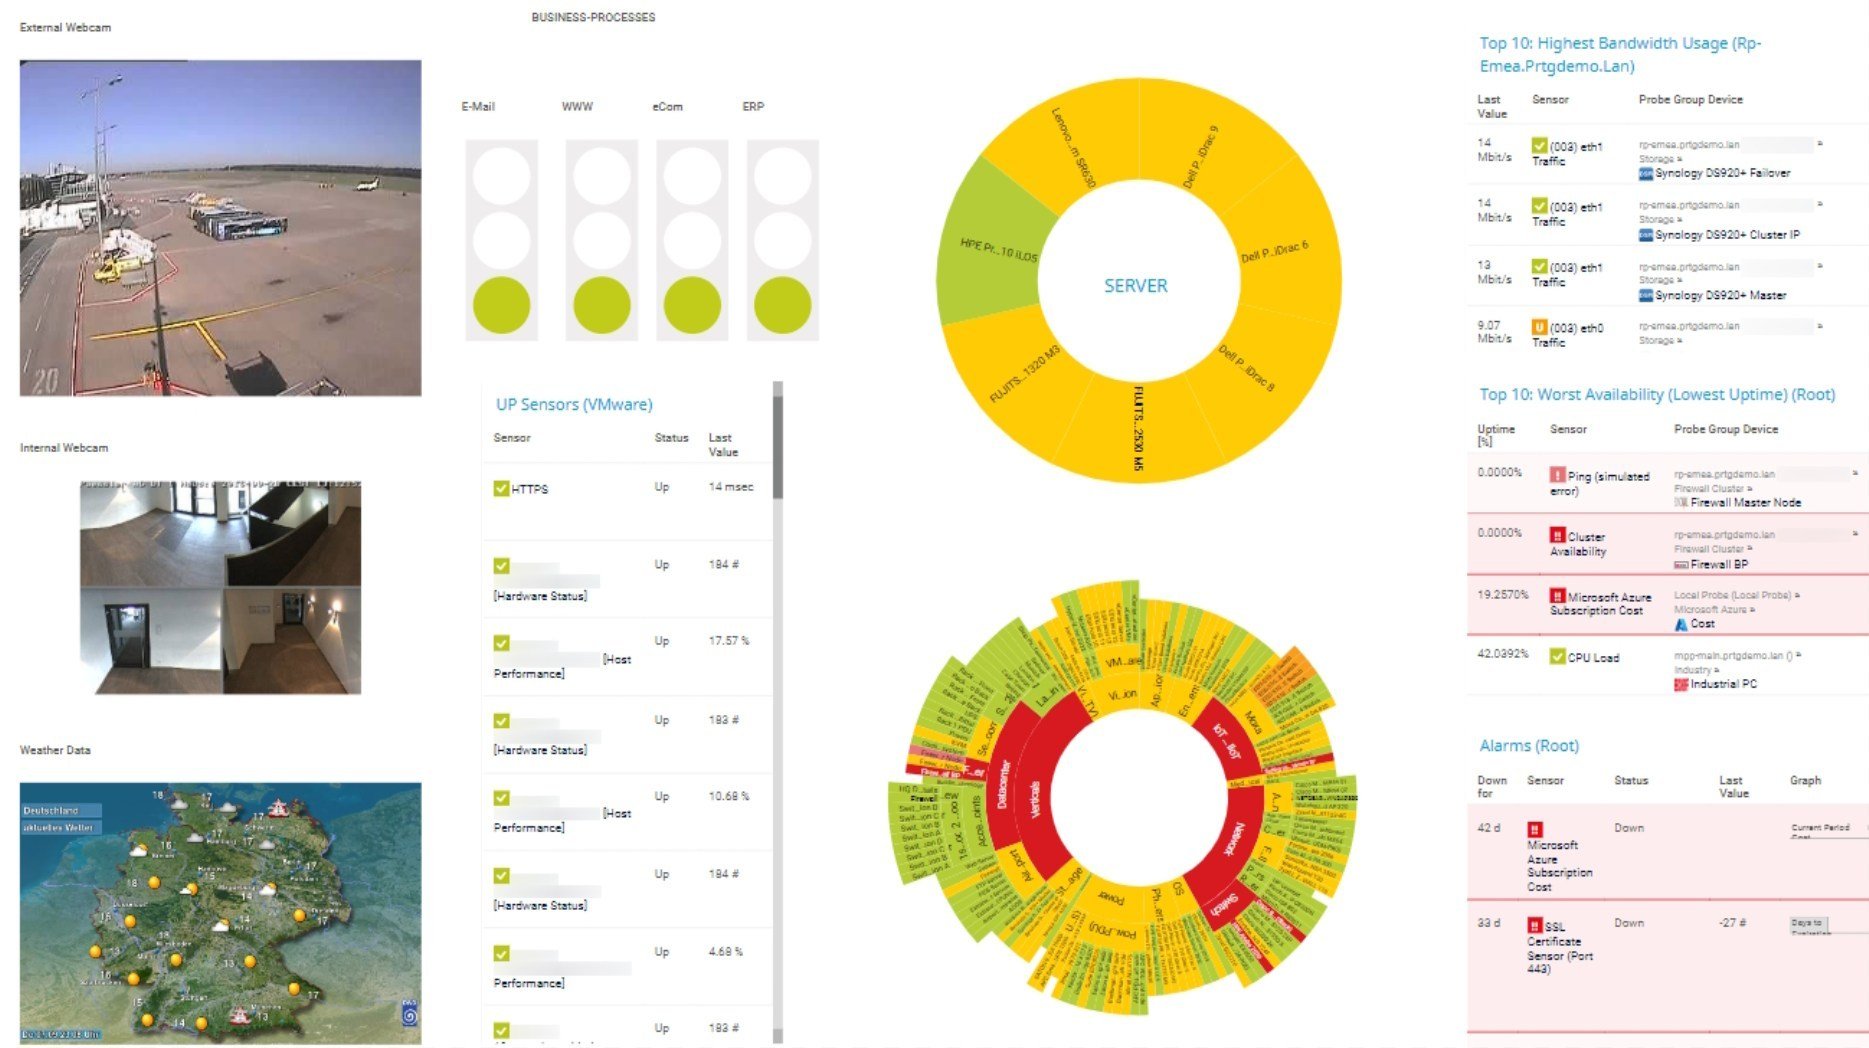
Custom PRTG dashboard for keeping an eye on the entire IT infrastructure

Live traffic data graph in PRTG

Device tree view of the complete monitoring setup
It's all in PRTG's sensors: sophisticated components that collect information about what's going on across your network.
Each sensor tracks a specific variable. Pick a warning and error threshold, and PRTG emails you, texts you, or sends an in-app notification if the variable goes above or below it.
Our range of preconfigured sensors can monitor:
Real-time notifications mean faster troubleshooting so that you can act before more serious issues occur.
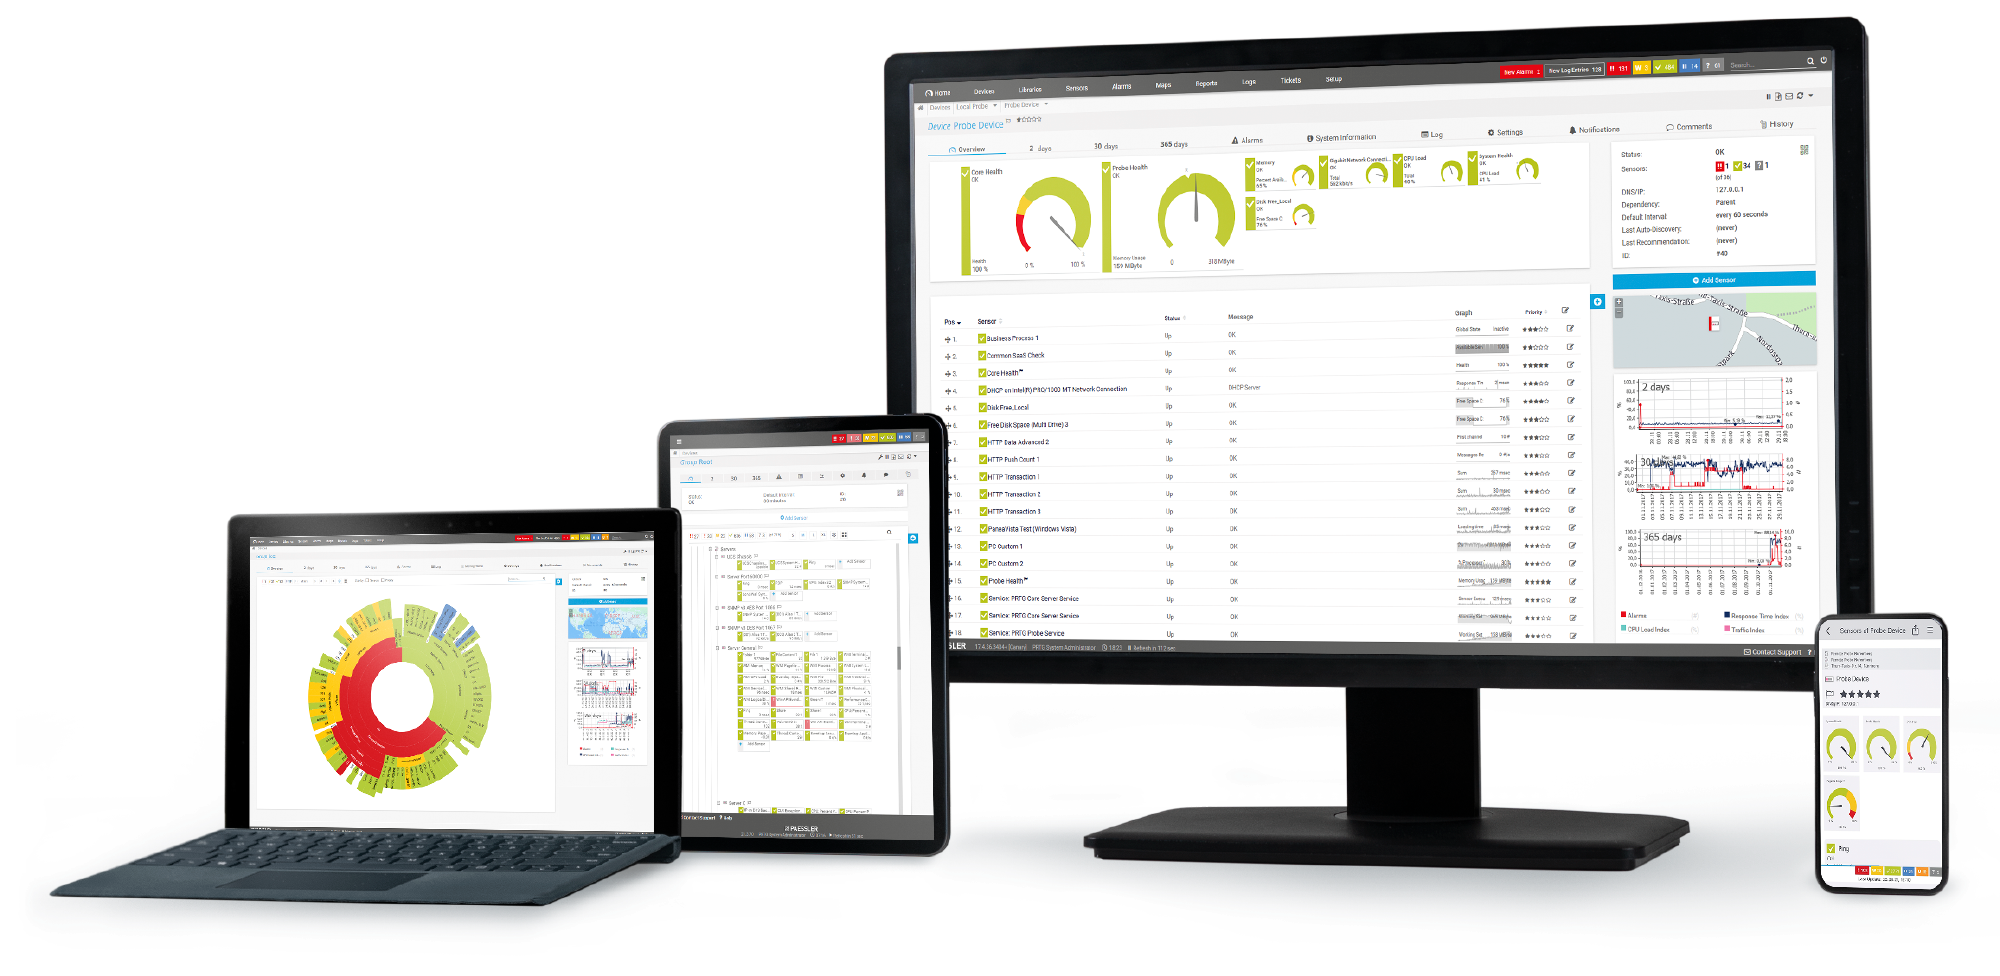
PRTG is set up in a matter of minutes and can be used on a wide variety of mobile devices.
Partnering with innovative IT vendors, Paessler unleashes synergies to create
new and additional benefits for joined customers.
Integrating monitoring results from PRTG into NetBrain maps makes the foundation for network automation.

Paessler and Plixer provide a complete solution adding flow and metadata analysis to a powerful network monitoring tool.

UVexplorer integrates tightly with PRTG to bring fast and accurate network discovery, detailed device inventory, and automatic network mapping to the PRTG platform.
Network Monitoring Software – Version 24.4.102.1351 (November 12th, 2024)
Download for Windows and cloud-based version PRTG Hosted Monitor available
English, German, Spanish, French, Portuguese, Dutch, Russian, Japanese, and Simplified Chinese
Network devices, bandwidth, servers, applications, virtual environments, remote systems, IoT, and more
Choose the PRTG Network Monitor subscription that's best for you
Network usage monitoring is the practice of tracking and analyzing the data traffic flowing through a computer network. It involves observing various parameters such as bandwidth consumption, internet usage, data transfer rates, and types of network activities. This monitoring helps network administrators understand how network resources are being utilized, identify potential bottlenecks or security threats, and optimize network performance.
By collecting and analyzing usage data, organizations can make informed decisions about resource allocation, capacity planning, and network security measures to enhance overall network efficiency and reliability.
Because it makes spotting (and fixing) network performance issues as easy as 1, 2, 3. PRTG keeps a close eye on your network's health stats and brings them together in comprehensive, easy-to-understand dashboards, enabling you to clear bottlenecks, load up on bandwidth, and ditch hardware that's past its prime before they slow your colleagues down (and your colleagues start calling to complain).
No – PRTG can do way more. As an all-in-one network monitoring tool, PRTG can monitor any network device and variable you can think of, from servers, routers, and firewalls to applications, cloud services, and virtual environments.
In PRTG, “sensors” are the basic monitoring elements. One sensor usually monitors one measured value in your network, for example the traffic of a switch port, the CPU load of a server, or the free space on a disk drive. On average, you need about 5-10 sensors per device or one sensor per switch port.
Paessler conducted trials in over 600 IT departments worldwide to tune its network monitoring software closer to the needs of sysadmins. The result of the survey: over 95% of the participants would recommend PRTG – or already have.
Paessler PRTG is used by companies of all sizes. Sysadmins love PRTG because it makes their job a whole lot easier.
Bandwidth, servers, virtual environments, websites, VoIP services – PRTG keeps an eye on your entire network.
Everyone has different monitoring needs. That’s why we let you try PRTG for free.