Custom alerts and data visualization let you quickly identify and prevent slow execution times, unresponsive database servers, and other issues in your database environment.
PRTG monitors your MySQL databases to help you ensure your applications are always available and can be accessed as quickly as possible. This helps you create a more reliable basis for the availability and performance of all your services in the tiers.
Without PRTG, if your database runs at a snail’s pace, returns errors for certain queries, or is not available at all, then the performance and quality of all applications and storage functionality dependent on that database will also suffer.

Everyone knows that web application that doesn’t load the stored data sets or keeps crashing all the time. PRTG lets you keep a constant eye on the availability of your MySQL database.
Reduce database downtime and immediately react to disruptions – for greater customer satisfaction and improved employee productivity.
Our MySQL monitoring software also keeps an eye on other MySQL performance data. It automatically queries databases and measures the time required for establishing a connection, executing an SQL query, handling a transaction, and disconnecting.
This way, you can make sure that your website or online store, for example, run smoothly and without hiccups.
Set custom performance thresholds, and PRTG will promptly alert you via SMS, email, Slack message, and other methods if your database is unavailable or if certain queries do not return the desired values (or return incorrect ones).
React to problems before they escalate and show your colleagues that you are always one step ahead of network issues.
With PRTG, you can create custom database reports and automatically distribute them to your team. Configure the content of your reports with the data you want, and generate them "on the fly” or create them automatically.
For example, you can forward the most important website stats to the Marketing team or have the number of open tickets automatically sent to the Support team.
Diagnose network issues by continuously tracking the availability and health of your MySQL servers, including query performance. Show query execution time, disk I/O operations, uptime, latency, response time, throughput and other key performance metrics in real time. Visualize monitoring data in clear graphs and dashboards to identify problems more easily. Gain the overview you need to troubleshoot slow queries, database bottlenecks, and other performance issues.

Live traffic data graph in PRTG

Device tree view of the complete monitoring setup

Custom PRTG dashboard for keeping an eye on the entire IT infrastructure
Live traffic data graph in PRTG
Device tree view of the complete monitoring setup
“All-around winning
network monitor”
“The real beauty of PRTG is the endless possibilities it offers”
“PRTG Network Monitor
is very hard to beat”
Use self-defined SQL queries to monitor a variety of KPIs, such as:
The possibilities are virtually endless. The only requirement: You must define an appropriate SQL statement.
Save your entire SQL statement in a separate query file on your hard drive in the PRTG program folder. Be sure to use the .sql file extension for the file and select the following path:
C:\Program Files (x86)\PRTG Network Monitor\Custom Sensors\sql\mysql
Add a device to the PRTG device tree that represents your MySQL instance, then add a MySQL v2 sensor.
Configure the sensor by choosing the SQL file which contains your SQL statement and decide, for example, if you simply wish to monitor MySQL query execution time or if you would also like to analyze and process data table values.
PRTG comes with more than 250 native sensor types for monitoring your entire on-premises, cloud, and hybrid cloud environment out of the box. Check out some examples below!
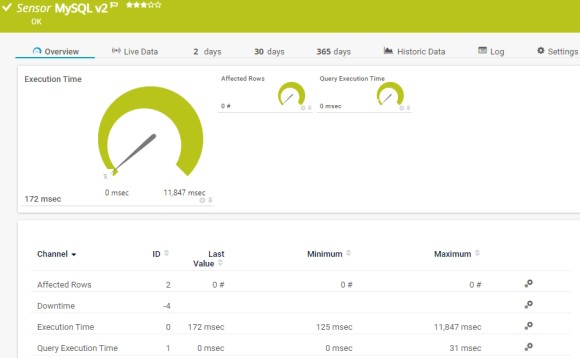
The MySQL v2 sensor monitors a database on a MySQL server and executes a query. It can show the following:
The ADO SQL v2 sensor monitors a database via an ActiveX Data Objects (ADO) connection and it executes an SQL query. It can show the following:
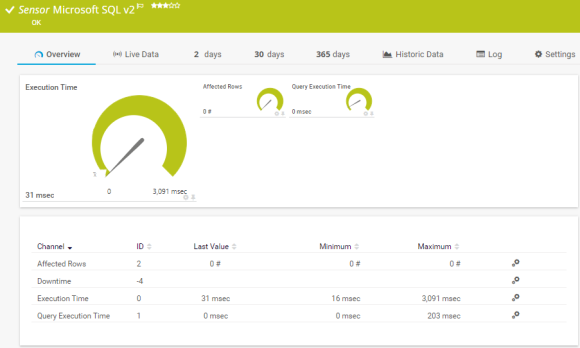
The Microsoft SQL v2 sensor monitors a database on a Microsoft SQL server and executes a query. It can show the following:
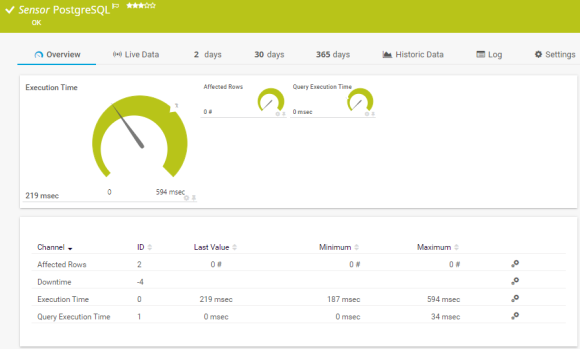
The PostgreSQL sensor monitors a database on a PostgreSQL server and executes a query. It can show the following:
See the PRTG Manual for a list of all available sensor types.

Custom alerts and data visualization let you quickly identify and prevent slow execution times, unresponsive database servers, and other issues with your database environment.
PRTG is set up in a matter of minutes and can be used on a wide variety of mobile devices.

Partnering with innovative IT vendors, Paessler unleashes synergies to create
new and additional benefits for joined customers.

Combining PRTG’s broad monitoring feature set with IP Fabric’s automated network assurance creates a new level of network visibility and reliability.

Siemon and Paessler bring together intelligent building technology and advanced monitoring and make your vision of intelligent buildings and data centers become reality.

UVexplorer integrates tightly with PRTG to bring fast and accurate network discovery, detailed device inventory, and automatic network mapping to the PRTG platform.
Real-time notifications mean faster troubleshooting so that you can act before more serious issues occur.
Network Monitoring Software – Version 24.4.102.1351 (November 12th, 2024)
Download for Windows and cloud-based version PRTG Hosted Monitor available
English, German, Spanish, French, Portuguese, Dutch, Russian, Japanese, and Simplified Chinese
Network devices, bandwidth, servers, applications, virtual environments, remote systems, IoT, and more
Choose the PRTG Network Monitor subscription that's best for you


MySQL is an open-source database management system based on structured query language (SQL). Along with being available for free, MySQL has the advantage that it runs on almost all platforms. MySQL is one of the most widely used relational database systems in the world, and many dynamic websites are built around it. Along with the open source variety, there is also a commercial MySQL Enterprise edition. MySQL has a pluggable storage engine architecture that allows users to select an individual storage engine like InnoDB or MyISAM.
MySQL monitoring involves the process of tracking and analyzing the performance, health, and usage of MySQL databases to ensure they are functioning optimally. It helps database administrators and developers identify potential issues, optimize performance, and maintain the reliability and availability of the database system. Key aspects of MySQL monitoring include:
Monitoring MySQL databases is important for several reasons, for example:
Absolutely. PRTG comes with preconfigured sensors for MS SQL, Oracle SQL, PostgreSQL, and ADO SQL. For monitoring databases like IBM DB2, SAP HANA, or SAP MaxDB, you will need the product extension PRTG Database Observer.
In PRTG, “sensors” are the basic monitoring elements. One sensor usually monitors one measured value in your network, for example the traffic of a switch port, the CPU load of a server, or the free space on a disk drive. On average, you need about 5-10 sensors per device or one sensor per switch port.
Paessler conducted trials in over 600 IT departments worldwide to tune its network monitoring software closer to the needs of sysadmins. The result of the survey: over 95% of the participants would recommend PRTG – or already have.

Paessler PRTG is used by companies of all sizes. Sysadmins love PRTG because it makes their job a whole lot easier.
Bandwidth, servers, virtual environments, websites, VoIP services – PRTG keeps an eye on your entire network.
Everyone has different monitoring needs. That’s why we let you try PRTG for free.