![]()
PRTG Enterprise Monitor – The superior alternative to DX Spectrum
Unified monitoring solution with advanced alert management
- All monitoring functionalities & visualization in a single solution
- Great usability and easy device configuration & management
- Advanced multi-tenancy capabilities for unlimited customers
Our users give top ratings for monitoring with Paessler PRTG


PRTG Enterprise Monitor as a DX Spectrum alternative: What you’ll find on this page

DX Spectrum vs. PRTG Enterprise Monitor
The advantages of both monitoring solutions at a glance
DX Spectrum
- Suitable for monitoring and managing dynamic, complex IT infrastructures
- High scalability
- Automatic network discovery including new software-defined networks (SDN)
- Graphic network topology mapping
- Event correlation
- Root cause identification and analysis
PRTG Enterprise Monitor
- Suitable for unified monitoring of dynamic, complex IT infrastructures
- High scalability
- Automatic network device discovery and initial monitoring setup
- Great visualization options including network topology maps and custom, widget-based dashboards
- At-a-glance root cause identification
- Historic data for more detailed root cause analysis and future capacity planning
- Advanced alerting and notification options to avoid alert fatigue
- In-depth, highly customizable reporting
- Subscription-based pricing with the full range of monitoring features included
- No expensive software bundles for different monitoring tasks
- Multi-tenancy capabilities included
- Complete offline monitoring of air-gapped systems for higher security
What network monitoring looks like in PRTG
Diagnose network issues by continuously tracking the health, availability, and performance of your entire IT infrastructure. Show hardware parameters, application performance, network traffic, bandwidth usage, and other key metrics in real time. Visualize data in clear graphs and dashboards to identify problems more easily. Gain the overview you need to troubleshoot all kinds of issues in your network.

Device tree view of the complete monitoring setup
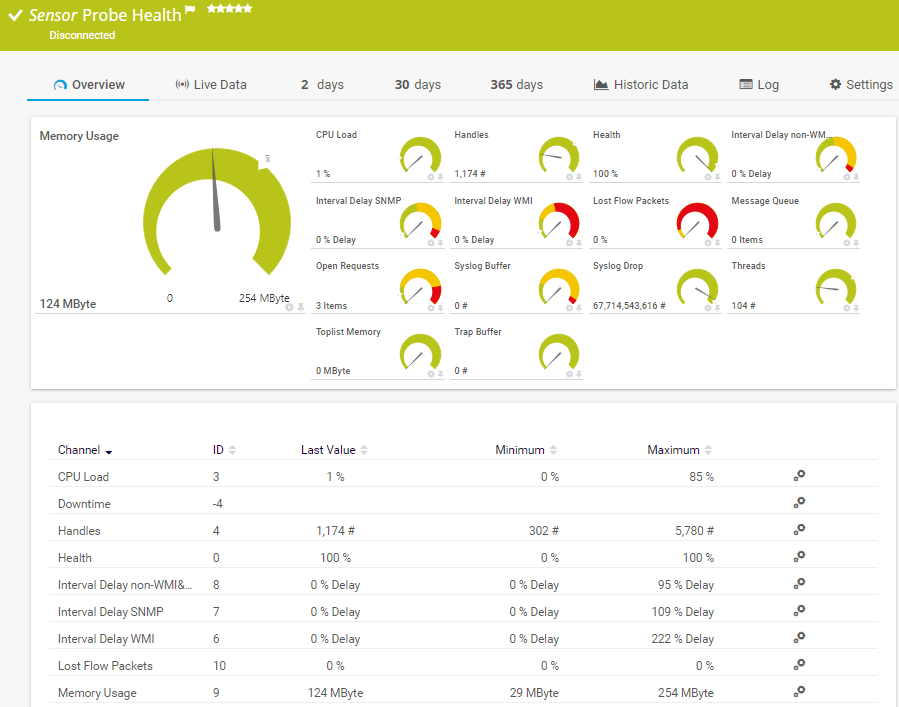
Preconfigured Probe Health sensor in PRTG

Custom PRTG dashboard for keeping an eye on the entire IT infrastructure
Start monitoring your network with PRTG and see how it can make your network more reliable and your job easier.
IT experts agree: Paessler PRTG is a great solution for IT infrastructure monitoring

“All-around winning
network monitor”

“The real beauty of PRTG is the endless possibilities it offers”

“PRTG Network Monitor
is very hard to beat”
Correlation of IT infrastructure & business layer vs. simple event correlation
IT systems are complex, dynamic, and need to consolidate many layers – from physical hardware to software applications and virtual environments, to the integration of on-premises, cloud, and hybrid infrastructures.
DX Spectrum: Only simple event correlation
DX Spectrum only covers your IT infrastructure layer. It does not offer a comprehensive overview of all your systems, nor does it keep a close eye on your business processes.
This means you only benefit from event correlation in your network infrastructure, but you do not get correlation of IT infrastructure and business service events and alarms.
PRTG Enterprise Monitor: Correlation with your business layer
PRTG Enterprise Monitor includes PRTG SLA Reporter and PRTG MultiBoard, two powerful product extensions to enhance your monitoring setup even further.
Use PRTG SLA Reporter to
- automatically generate up-to-the-minute SLA reports, either on demand or via schedule
- define your required service level agreements and map dedicated PRTG sensors to them
Deploy PRTG MultiBoard for
- a complete overview across multiple PRTG servers, customized to your needs
- a central management of your monitoring setup in a single pane of glass
PRTG vs. other monitoring tools
We also compared PRTG with other monitoring tools:
PRTG Enterprise Monitor vs. SolarWinds
PRTG Network Monitor vs. ManageEngine OpManager
Find the root cause of the problem with our PRTG network monitoring solution
Real-time notifications mean faster troubleshooting so that you can act before more serious issues occur.
PRTG is compatible with all major vendors, products, and systems
![]()
Save money with PRTG Enterprise Monitor
PRTG Enterprise Monitor comes with a flexible subscription license that’s easy to scale without hassle. It’s based on the required number of monitoring aspects, known as PRTG sensors, and the duration of the subscription.
- Only pay for the number of sensors you need
- Reduce costs with longer subscriptions – 1, 3, or 5 years
- Easily scale your subscription as your network grows
- All monitoring features & maintenance included with every license

Need help making a decision?
You are interested to know if PRTG Enterprise Monitor could be an alternative to your DX Spectrum implementation? Contact us for more information.
Your DX Spectrum alternative PRTG at a glance – even on the go
Set up PRTG in minutes and use it on almost any mobile device.


PRTG makes network monitoring as easy as it gets
Custom alerts and data visualization let you quickly identify and prevent all kinds of network issues.
Create innovative solutions with Paessler’s partners
Partnering with innovative vendors, Paessler unleashes synergies to create
new and additional benefits for joined customers.


UVnetworks
UVexplorer integrates tightly with PRTG to bring fast and accurate network discovery, detailed device inventory, and automatic network mapping to the PRTG platform.
More than just a monitoring tool:
Reasons our customers love PRTG


PRTG: The multi-tool for sysadmins
Adapt PRTG individually and dynamically to your needs and rely on a strong API:- HTTP API: Access monitoring data and manipulate monitoring objects via HTTP requests
- Custom sensors: Create your own PRTG sensors for customized monitoring
- Custom notifications: Create your own notifications and send action triggers to external systems
- REST Custom sensor: Monitor almost everything that provides data in XML or JSON format
Still not convinced?
![]()
More than 500,000
sysadmins love PRTG
Paessler PRTG is used by companies of all sizes. Sysadmins love PRTG because it makes their job a whole lot easier.
![]()
Monitor your entire IT infrastructure
Bandwidth, servers, virtual environments, websites, VoIP services – PRTG keeps an eye on your entire network.
![]()
Try Paessler PRTG
for free
Everyone has different monitoring needs. That’s why we let you try PRTG for free.
![]()
Start monitoring your network with PRTG and see how it can make your network more reliable and your job easier.
|
PRTG |
Network Monitoring Software - Version 25.1.104.1961 (April 7th, 2025) |
|
Hosting |
Download for Windows and cloud-based version PRTG Hosted Monitor available |
Languages |
English, German, Spanish, French, Portuguese, Dutch, Russian, Japanese, and Simplified Chinese |
Pricing |
Up to 100 sensors for free (Price List) |
Unified Monitoring |
Network devices, bandwidth, servers, applications, virtual environments, remote systems, IoT, and more |
Supported Vendors & Applications |
|
Discover more monitoring insights and stories

Solutions for all your monitoring needs

Powerful stories from the monitoring world

Combining the broad monitoring feature set of PRTG with IP Fabric’s automated network assurance creates a new level of network visibility and reliability.