Custom alerts and data visualization let you quickly identify and prevent performance bottlenecks and network congestion.
In the high-speed, complex world of IT, your Linux systems need to operate without a hitch. Paessler PRTG delivers extensive Linux performance monitoring, ensuring your infrastructure runs as smooth as silk. Spot and tackle performance issues before they throw a wrench in your operations. Consider PRTG your system's backstage crew, ensuring every performance is award-worthy.
Your storage subsystem is the vault where your critical data resides. PRTG monitors disk I/O, disk usage, and filesystem performance, helping you catch issues that could impair your applications.
Sluggish disk read or input/output speeds can delay data access, but with PRTG, you can boost storage operations and sidestep potential performance bottlenecks – keeping your data flowing without a hiccup, and system administrators sane.
Memory is the backbone of your Linux system’s performance. PRTG keeps tabs on memory usage and resource utilization, painting a clear picture of how your resources are allocated.
By spotting memory leaks or overuse in your system activity, you can stave off slowdowns in running processes and maintain top performance levels. After all, who wants a system that can’t remember what it’s supposed to do?
At the heart of your Linux system is the CPU – your command center, handling every critical operation. PRTG provides live data on the CPU utilization of your Linux-based servers, letting you quickly pinpoint potential bottlenecks.
A strained CPU can slow down your system, affecting overall performance. Armed with PRTG’s insights, you can fine-tune processes to keep your applications motors purring smoothly.
If other system metrics are important, network performance is paramount. PRTG’s network monitoring tools let you oversee network traffic, network usage, and bandwidth on your Linux servers.
By watching these metrics, you can identify congestion, fine-tune network interfaces, and ensure reliable connectivity – imperative for sustaining high uptime and smooth communications.
Diagnose network issues by continuously tracking the availability, health, and performance of your Linux system. Show CPU usage, memory usage, disk I/O, load average, virtual memory statistics, and other key metrics in real time. Visualize monitoring data in clear graphs and dashboards to identify problems more easily. Gain the overview you need to troubleshoot slow system processes and other issues in your Linux network.

Live traffic data graph in PRTG
Overview of AWS, Linux and Windows services with PRTG

Device tree view of the complete monitoring setup

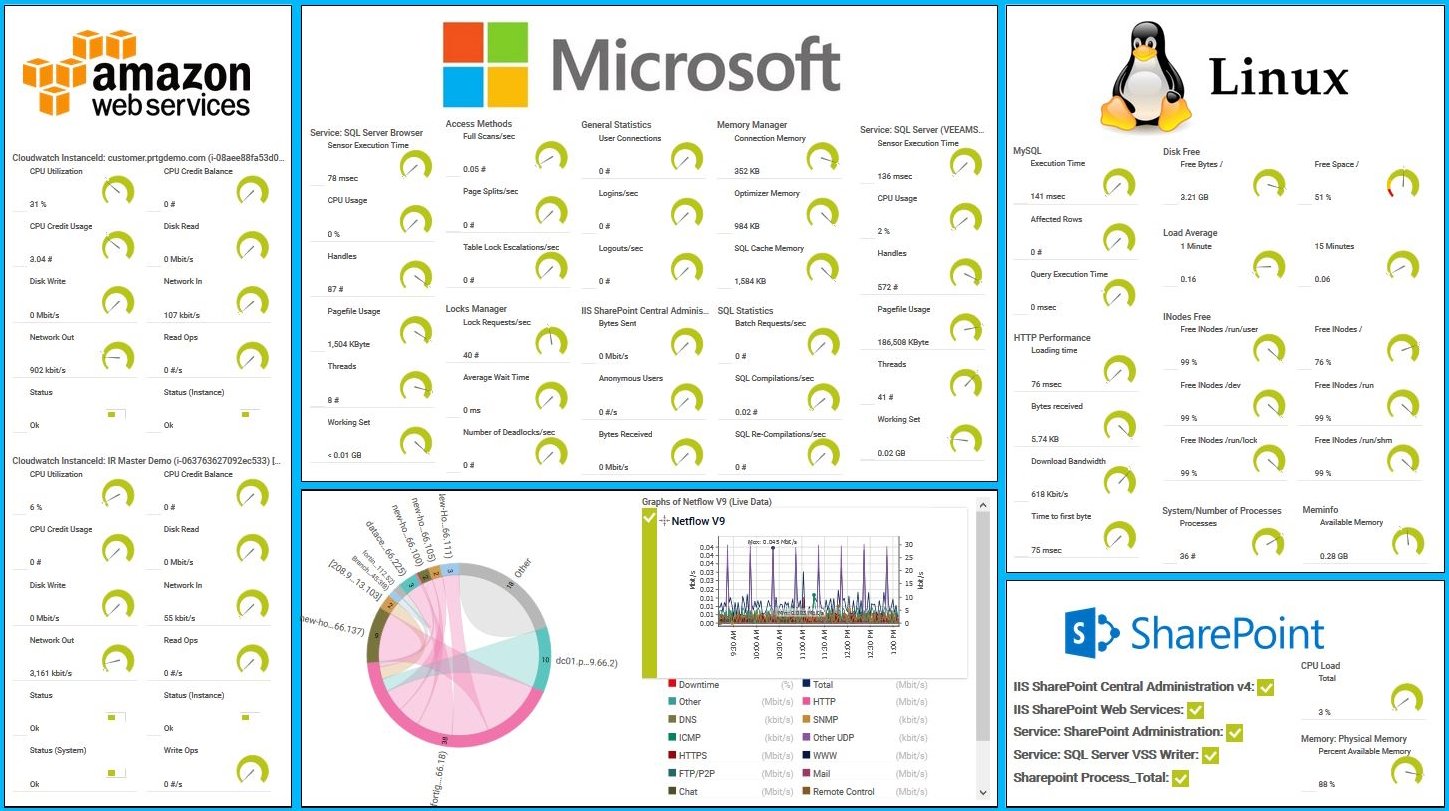
Custom PRTG dashboard for keeping an eye on the entire IT infrastructure
Live traffic data graph in PRTG
Overview of AWS, Linux and Windows services with PRTG
“All-around winning
network monitor”
“The real beauty of PRTG is the endless possibilities it offers”
“PRTG Network Monitor
is very hard to beat”
PRTG comes with more than 250 native sensor types for monitoring your entire on-premises, cloud, and hybrid cloud environment out of the box. Check out some examples below!
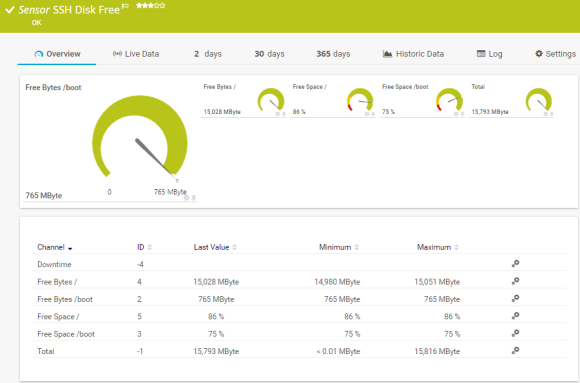
The SSH Disk Free sensor monitors the free space on disks of a Linux/Unix system using Secure Shell (SSH). It can show the following:
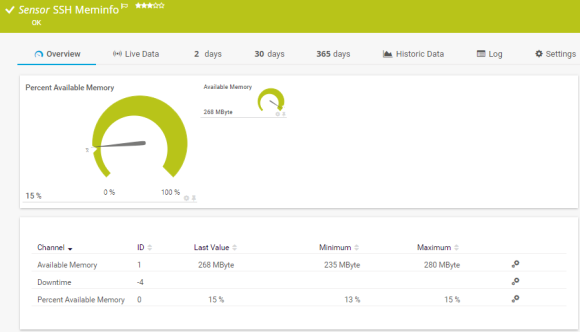
The SSH Meminfo sensor monitors the memory usage of a Linux/Unix system using Secure Shell (SSH). It can show the following:
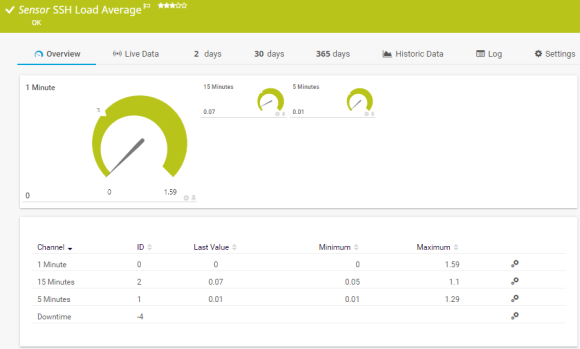
The SSH Load Average sensor monitors the load average of a Linux/Unix system using Secure Shell (SSH). It can show the following:
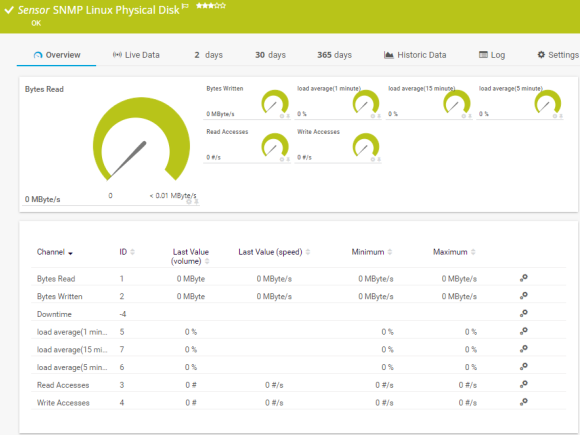
The SNMP Linux Physical Disk sensor monitors the input/output (I/O) on disks of a Linux/Unix system. It can show the following:
See the PRTG Manual for a list of all available sensor types.

Real-time notifications mean faster troubleshooting so that you can act before more serious issues occur.
PRTG is set up in a matter of minutes and can be used on a wide variety of mobile devices.


“Excellent tool for detailed monitoring. Alarms and notifications work greatly. Equipment addition is straight forward and server initial setup is very easy. ...feel safe to purchase it if you intend to monitor a large networking landscape.”
Partnering with innovative IT vendors, Paessler unleashes synergies to create
new and additional benefits for joined customers.
IT that works constitutes a business-critical basis for a company's success. Availability and security must be defined for the respective purpose and closely monitored – by OT and IT alike.

Paessler and Plixer provide a complete solution adding flow and metadata analysis to a powerful network monitoring tool.

Siemon and Paessler bring together intelligent building technology and advanced monitoring and make your vision of intelligent buildings and data centers become reality.
Custom alerts and data visualization let you quickly identify and prevent performance bottlenecks and network congestion.
Network Monitoring Software – Version 24.4.102.1351 (November 12th, 2024)
Download for Windows and cloud-based version PRTG Hosted Monitor available
English, German, Spanish, French, Portuguese, Dutch, Russian, Japanese, and Simplified Chinese
Network devices, bandwidth, servers, applications, virtual environments, remote systems, IoT, and more
Choose the PRTG Network Monitor subscription that's best for you


PRTG employs protocols like SNMP and SSH to monitor your Linux system, collecting data on CPU usage, memory usage, disk I/O, and network performance to offer a comprehensive health check. Although PRTG doesn't use Linux command line tools directly, it enables custom sensor setups for executing specific commands via SSH for deeper insights.
Yes, PRTG supports a broad array of Linux distributions, including Ubuntu, CentOS, Red Hat, and Debian, ensuring uniform monitoring and analysis across your infrastructure – a real polyglot in the Linux world.
Absolutely. PRTG delivers robust network monitoring specifically tailored for Linux environments. It oversees network traffic, network usage, network interfaces, and bandwidth, shedding light on potential bottlenecks and aiding in maintaining strong network health.
Indeed, PRTG's detailed metrics and historical data enable you to scrutinize trends in resource usage and system load, guiding informed decisions about resource scaling, configuration optimization, and future planning – essentially, it’s your strategic planner for infrastructure growth.
Yes and no. If you use PRTG Network Monitor or PRTG Enterprise Monitor, the central PRTG server can only be installed on a Windows server. But, once you've installed the PRTG server, you can use the brand-new multi-platform probe that also runs on Linux. With this probe, you can monitor and manage your complete IT infrastructure from your Linux system. If you use PRTG Hosted Monitor, you do not need a dedicated Windows server at all.
In PRTG, “sensors” are the basic monitoring elements. One sensor usually monitors one measured value in your network, for example the traffic of a switch port, the CPU load of a server, or the free space on a disk drive. On average, you need about 5-10 sensors per device or one sensor per switch port.
Paessler conducted trials in over 600 IT departments worldwide to tune its network monitoring software closer to the needs of sysadmins. The result of the survey: over 95% of the participants would recommend PRTG – or already have.

Paessler PRTG is used by companies of all sizes. Sysadmins love PRTG because it makes their job a whole lot easier.
Bandwidth, servers, virtual environments, websites, VoIP services – PRTG keeps an eye on your entire network.
Everyone has different monitoring needs. That’s why we let you try PRTG for free.