SLA monitoring with PRTG
Monitor and report on service level agreements with PRTG Enterprise Monitor & PRTG SLA Reporter
- Service-based SLA monitoring for highest availability
- Full transparency on compliance with SLAs
- Up-to-the-minute SLA reports to inform your stakeholders
PRTG makes service level agreement monitoring as easy as it gets
Custom alerts and data visualization let you quickly identify and prevent slow resolution time, outages, and other service delivery issues.
Enhance PRTG Enterprise Monitor with PRTG SLA Reporter
Combine the two solutions for even better SLA monitoring & reporting
Whether you monitor websites, services, applications, or specific devices in IT infrastructures that play an important role in production and business processes – all of these components should (ideally) be available at all times.
However, planned maintenance windows and unplanned downtimes mean that you can’t usually guarantee 100% availability. This is where the magic "five nines" – or 99.999% target availability – come into play.
With PRTG Enterprise Monitor and our product extension PRTG SLA Reporter, getting SLA monitoring in combination with powerful SLA reporting to keep track of your 99.999% is just a few clicks away.
How PRTG monitors SLA performance
Service level agreements are as different as the types of services a customer needs from a provider. It’s vital to define measurable service level objectives (SLOs) based on key performance indicators. This way, the parties involved can concretely show, based on numbers, how well (or poorly) service providers are achieving their service goals.
Paessler PRTG can measure these common types of SLAs, and more:
- Availability or uptime: The percentage of time that a device has been working or a service has been available and accessible to the customer.
- Business results: The calculation, based on KPIs, of how service provider offers impact business performance.
- Defect rate or error rate: The percentage of errors in the services provided, such as programming errors or missed deadlines.
- MTBF (Mean Time between Failures): The time elapsed before a fault or failure occurs.
- MTTR (Mean Time to Recovery/Repair): The time it takes to recover from errors or failures by repairing a system or bringing it back online.
- Security: The measurement of controllable security measures such as antivirus updates or the application of patches.
Your SLA monitor at a glance – even on the go
Set up PRTG in minutes and use it on almost any mobile device.


What effective SLA monitoring & reporting looks like in PRTG
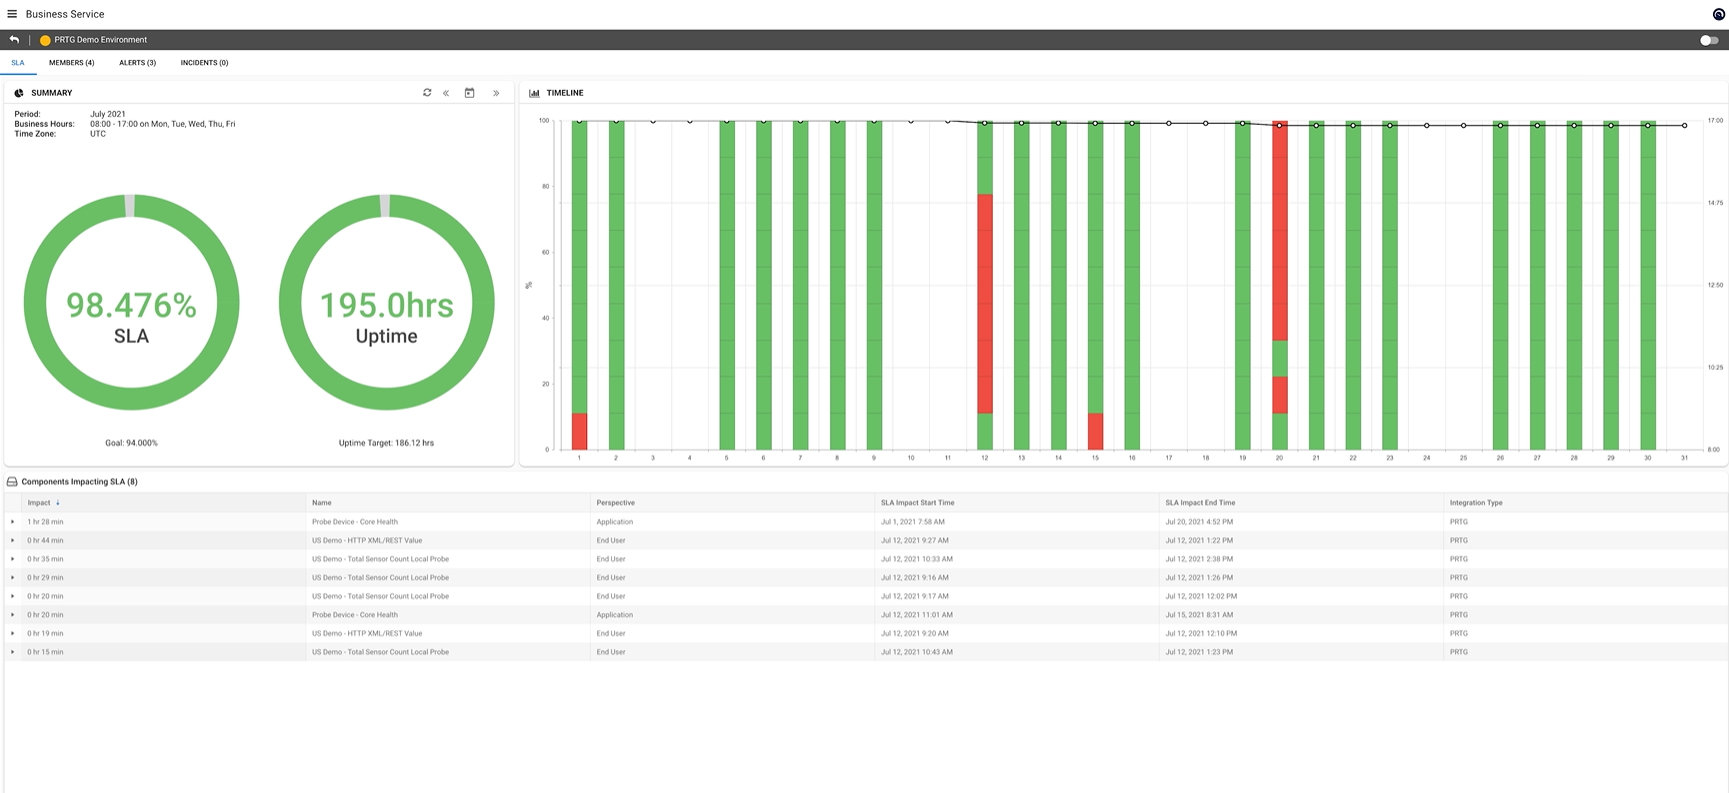
Diagnose network issues by continuously tracking the availability of your applications, services, and your entire network. Show response time, uptime and downtime, quality of service, and other key SLA metrics in real time. Visualize monitoring data in clear graphs and dashboards to identify problems more easily. Gain the overview you need to troubleshoot performance issues and report on SLA compliance.

Device tree view of the complete monitoring setup

Detailed SLA metrics for SLA reports

Custom PRTG dashboard for keeping an eye on the entire IT infrastructure
Start SLA performance monitoring with PRTG and see how it can make your network more reliable and your job easier.
PRTG is compatible with all major vendors, products, and systems
4 reasons to choose PRTG as your SLA monitoring tool
Designed for 99.999% availability
Every system failure leads to lost sales and customer complaints, making high availability essential with as little disruptions and downtime as possible.
With PRTG, you always have an eye on the targeted 99.999% uptime, no matter how ambitious these goals may seem.
Service optimization through transparency
As a service provider, you can increase customer satisfaction by providing quantified information about the status of SLA compliance at any time.
Plus, in-depth SLA reporting with PRTG also makes it easier for you to offer transparency by communicating with the customer about the causes that led to downtime.
Custom visualization tailored to your needs
Large IT infrastructures require a monitoring solution that provides a complete overview of the entire infrastructure, including at-a-glance visualization.
With PRTG, you get all this in custom dashboards. Clear color coding always shows you if everything is okay or if there is a problem.
Easy availability of data for SLA reporting
PRTG lets you report on SLAs based on historical monitoring data (uptime & downtime) and across multiple PRTG servers.
Plus, you can store your SLA data separately from PRTG in an MS SQL database and deploy third-party tools you already have in your company for creating custom SLA reports.
Create innovative solutions with Paessler’s partners
Partnering with innovative vendors, Paessler unleashes synergies to create
new and additional benefits for joined customers.
ScriptRunner
With ScriptRunner, Paessler integrates a powerful event automation platform into PRTG Network Monitor.
“Excellent tool for detailed monitoring. Alarms and notifications work greatly. Equipment addition is straight forward and server initial setup is very easy. ...feel safe to purchase it if you intend to monitor a large networking landscape.”
Infrastructure and Operations Engineer in the Communications Industry, firm size 10B - 30B USD
Find the root cause of the problem with our PRTG SLA management solution
Real-time notifications mean faster troubleshooting so that you can act before more serious issues occur.
We asked: would you recommend PRTG?
Over 95% of our customers say yes!
Paessler conducted trials in over 600 IT departments worldwide to tune its network monitoring software closer to the needs of sysadmins.
The result of the survey: over 95% of the participants would recommend PRTG – or already have.

PRTG: The multi-tool for sysadmins
Adapt PRTG individually and dynamically to your needs and rely on a strong API:- HTTP API: Access monitoring data and manipulate monitoring objects via HTTP requests
- Custom sensors: Create your own PRTG sensors for customized monitoring
- Custom notifications: Create your own notifications and send action triggers to external systems
- REST Custom sensor: Monitor almost everything that provides data in XML or JSON format
Still not convinced?
More than 500,000
sysadmins love PRTG
Paessler PRTG is used by companies of all sizes. Sysadmins love PRTG because it makes their job a whole lot easier.
Monitor your entire IT infrastructure
Bandwidth, servers, virtual environments, websites, VoIP services – PRTG keeps an eye on your entire network.
Try Paessler PRTG
for free
Everyone has different monitoring needs. That’s why we let you try PRTG for free.
Start monitoring and reporting on SLAs with PRTG and see how it can make your network more reliable and your job easier.
|
PRTG |
Network Monitoring Software - Version 25.1.104.1961 (April 7th, 2025) |
|
Hosting |
Download for Windows and cloud-based version PRTG Hosted Monitor available |
Languages |
English, German, Spanish, French, Portuguese, Dutch, Russian, Japanese, and Simplified Chinese |
Pricing |
Up to 100 sensors for free (Price List) |
Unified Monitoring |
Network devices, bandwidth, servers, applications, virtual environments, remote systems, IoT, and more |
Supported Vendors & Applications |
|


Combining the broad monitoring feature set of PRTG with IP Fabric’s automated network assurance creates a new level of network visibility and reliability.