Custom alerts and data visualization let you quickly identify and prevent performance issues.
Are you looking for a way to stay ahead of performance issues in your virtual environment? Keep a close eye on critical metrics such as CPU usage, memory allocation, and disk performance. Identify bottlenecks before they escalate, prevent downtime, and easily optimize your resource allocation. With Paessler PRTG, you can ensure a stable and efficient virtual infrastructure.
Diagnose network issues by continuously tracking vSphere performance. Show latency, bandwidth, and other key metrics in real time. Visualize monitoring data in clear graphs and dashboards to identify problems more easily. Gain the overview you need to troubleshoot performance bottlenecks.

Live traffic data graph in PRTG

Device tree view of the complete monitoring setup
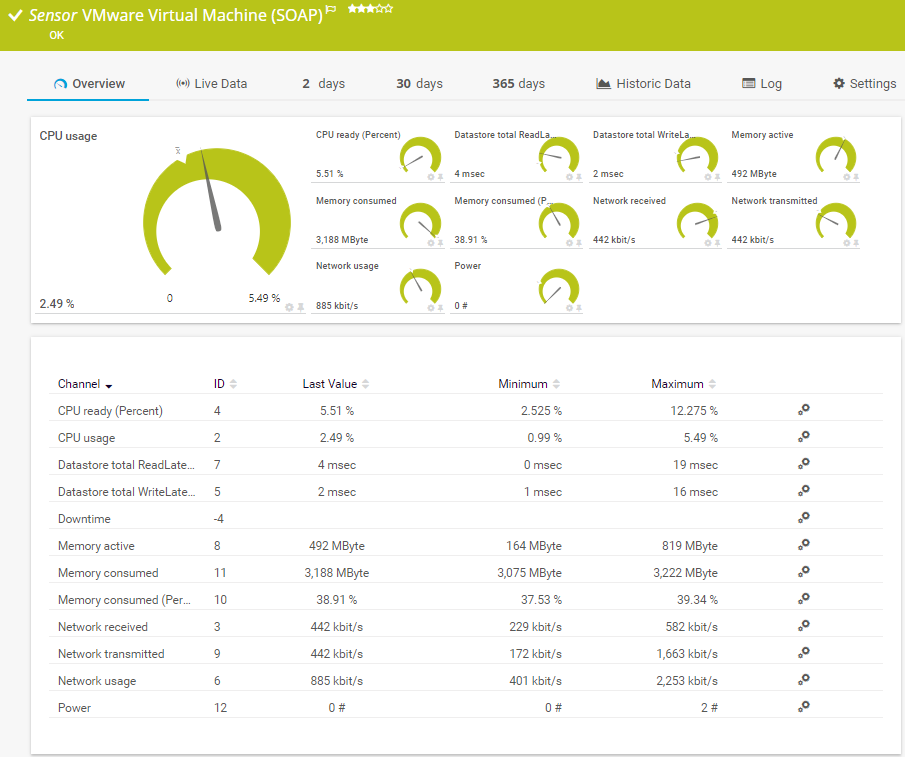
Monitoring virtual machine with PRTG
Live traffic data graph in PRTG
Device tree view of the complete monitoring setup
“All-around winning
network monitor”
“The real beauty of PRTG is the endless possibilities it offers”
“PRTG Network Monitor
is very hard to beat”
Managing a VMware vSphere environment can be complex, but PRTG simplifies your workflow. Whether it's setting up in minutes or getting fast support when you need it, PRTG is designed to make your life easier. Trust a tool that focuses on giving you reliable monitoring with minimal effort.
Get up and running quickly with an intuitive installation process and pre-configured sensors. Avoid wasting time on complex configurations or lengthy onboarding. Be up and running in minutes so you can focus on what matters most - your virtual environment.
Choose a subscription model that fits the current size of your business, whether you need a small setup or enterprise-level coverage. If you need more sensors, simply scale your license as your infrastructure grows without adding complexity. Get a monitoring solution that grows with you.
Get expert help when you need it with responsive customer support. Rely on a team that understands your challenges and delivers solutions that fit your environment. Never forget: you are not alone when troubleshooting performance issues.
Stay ahead of technology changes with regular updates that improve functionality and ensure compatibility. Benefit from a monitoring tool that keeps pace with the evolving needs of your virtual infrastructure. Rely on a solution that always works.
PRTG comes with more than 250 native sensor types for monitoring your entire on-premises, cloud, and hybrid cloud environment out of the box. Check out some examples below!
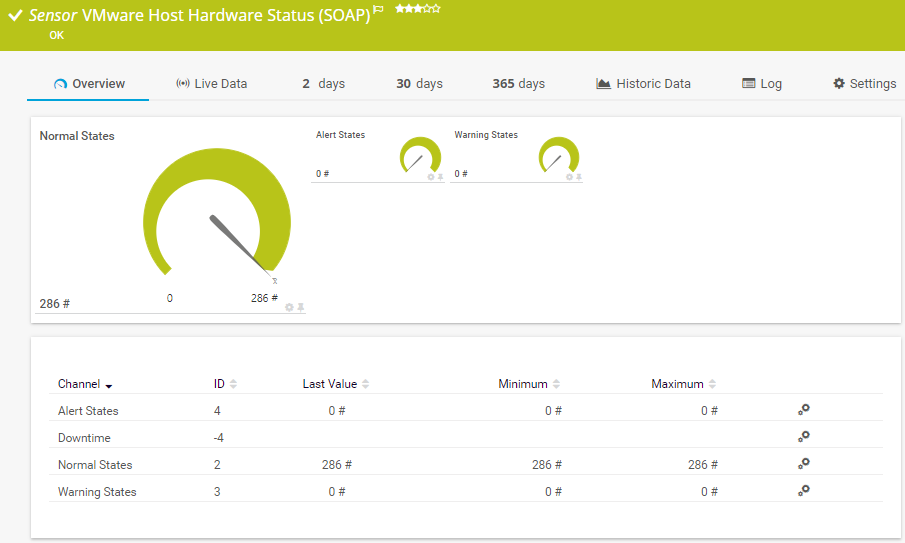
The VMware Host Hardware Status (SOAP) sensor monitors the hardware status of a VMware host server using the Simple Object Access Protocol (SOAP). It gives you a general status overview of the host. It can show the following:
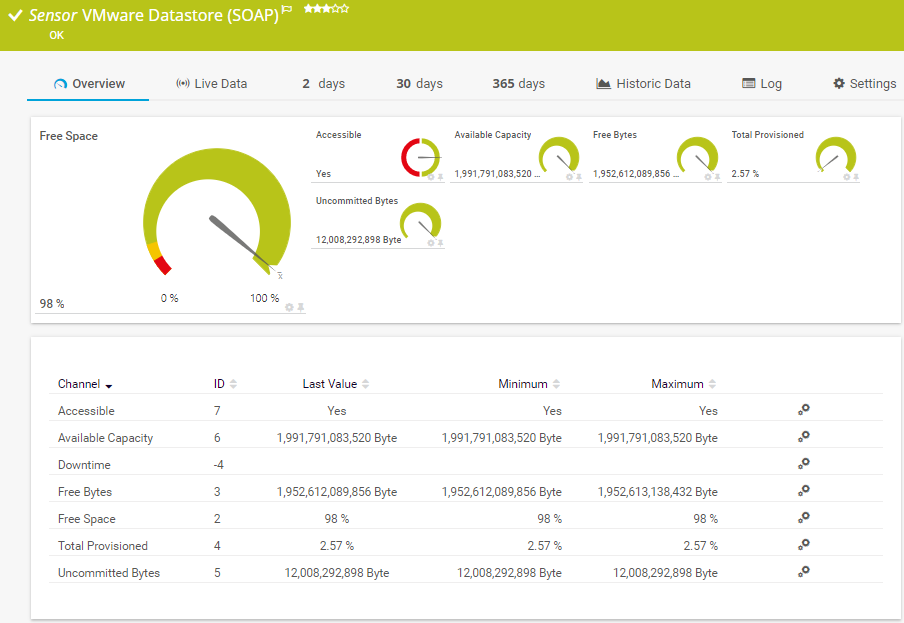
The VMware Datastore (SOAP) sensor monitors the disk usage of a VMware datastore using the Simple Object Access Protocol (SOAP). It can show the following:
The VMware Virtual Machine (SOAP) sensor monitors a virtual machine (VM) on a VMware host server using the Simple Object Access Protocol (SOAP). It can show the following and more:
CPU readiness and usage
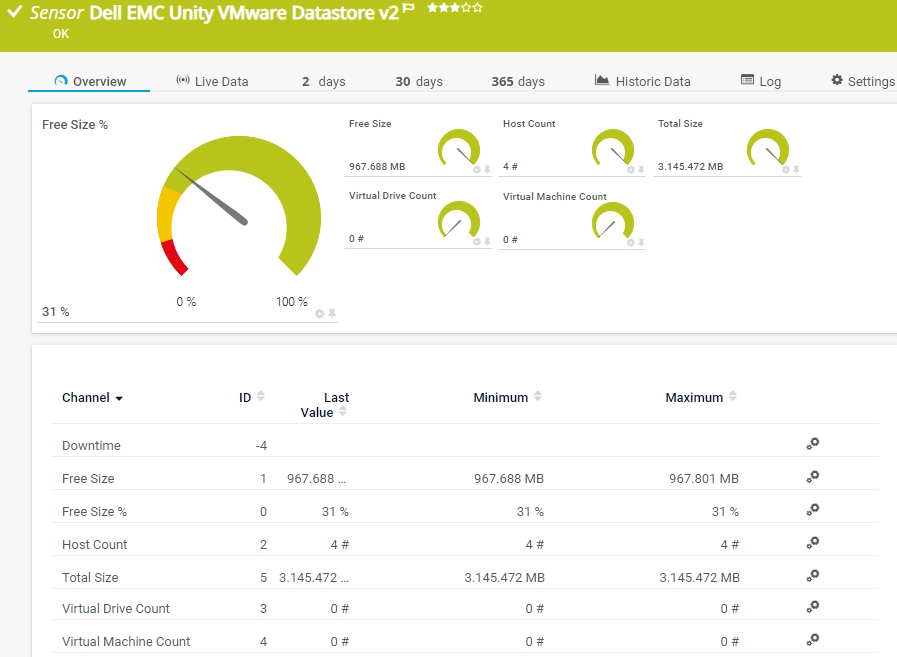
The Dell EMC Unity VMware Datastore v2 sensor monitors a VMware datastore on a Dell EMC storage system. It can show the following:
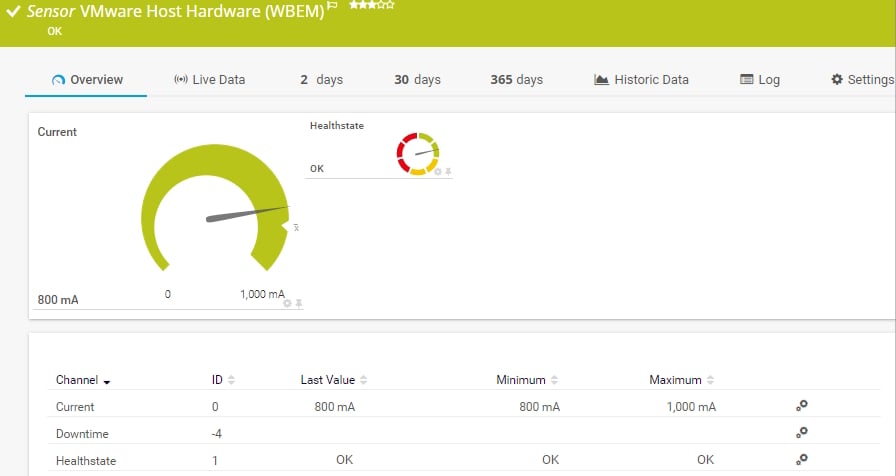
The VMware Host Hardware (WBEM) sensor monitors information about the hardware of an ESXi server using Web-based Enterprise Management (WBEM). It can show the following:
See the PRTG Manual for a list of all available sensor types.

Custom alerts and data visualization let you quickly identify and prevent performance bottlenecks.
PRTG is set up in a matter of minutes and can be used on a wide variety of mobile devices.

Paessler achieved VMware's highest level of endorsement due to our technological excellence, leading market position, and superior compatibility with VMware products.
What does this mean for you?
Partnering with innovative IT vendors, Paessler unleashes synergies to create
new and additional benefits for joined customers.

baramundi and PRTG create a secure, reliable and powerful IT infrastructure where you have everything under control - from the traffic in your firewall to the configuration of your clients.
IT that works constitutes a business-critical basis for a company's success. Availability and security must be defined for the respective purpose and closely monitored – by OT and IT alike.
Integrating monitoring results from PRTG into NetBrain maps makes the foundation for network automation.
Real-time notifications mean faster troubleshooting so that you can act before more serious issues occur.
Network Monitoring Software – Version 24.4.102.1351 (November 12th, 2024)
Download for Windows and cloud-based version PRTG Hosted Monitor available
English, German, Spanish, French, Portuguese, Dutch, Russian, Japanese, and Simplified Chinese
Network devices, bandwidth, servers, applications, virtual environments, remote systems, IoT, and more
Choose the PRTG Network Monitor subscription that's best for you
A vSphere performance monitoring tool tracks and analyzes the performance of VMware vSphere environments. It monitors key metrics such as CPU usage, memory usage, network performance, and data store activity. By providing insights into these metrics, the tool helps detect performance problems, optimize resource allocation, and ensure a stable virtual infrastructure.
PRTG makes VMware vSphere monitoring easy and effective. It continuously tracks virtual machine performance, network utilization, and resource pools. By integrating with the vSphere Client and vCenter Server, it collects data directly from the hypervisor to provide real-time insights. You can quickly identify bottlenecks in compute resources, storage devices, and virtual disks to keep your data center operating at peak performance.
Yes, PRTG monitors storage devices and virtual disks in your vSphere environment. It tracks disk space, IOPS, and latency, giving you a clear picture of performance across your data storage. This level of detail helps prevent storage-related performance problems and ensures resource allocation is optimized for all virtual machines.
PRTG supports monitoring of virtual machines running Linux, Windows, and other guest operating systems. It identifies metrics such as memory usage, CPU load and network connectivity to optimize performance for each guest OS in your virtual infrastructure. Whether you use Microsoft-based applications or open-source platforms, PRTG has you covered.
PRTG provides real-time monitoring and customizable alerts to help you detect performance problems as they occur. It tracks processors, network connectivity and memory usage to help you understand the root cause of problems. By proactively addressing bottlenecks in virtual machines, ESXi hosts, and data stores, you can prevent downtime and ensure smooth operations.
Yes, PRTG monitors vMotion and tracks performance during resource migration. It ensures that workloads are efficiently migrated without disrupting your virtual environment. By analyzing metrics such as network bandwidth, compute resources, and storage availability, you can confidently manage resource pools and ensure optimal performance.
PRTG combines ease of use with comprehensive functionality, making it a leading choice for vSphere monitoring. It supports integration with VMware tools, interactive dashboards for detailed performance charts, and APIs for custom solutions. In addition, PRTG monitors MHz utilization, network utilization, and application performance to ensure that your virtual infrastructure runs smoothly from the datacenter to each guest OS.
In PRTG, “sensors” are the basic monitoring elements. One sensor usually monitors one measured value in your network, for example the traffic of a switch port, the CPU load of a server, or the free space on a disk drive. On average, you need about 5-10 sensors per device or one sensor per switch port.
Paessler conducted trials in over 600 IT departments worldwide to tune its network monitoring software closer to the needs of sysadmins. The result of the survey: over 95% of the participants would recommend PRTG – or already have.

Paessler PRTG is used by companies of all sizes. Sysadmins love PRTG because it makes their job a whole lot easier.
Bandwidth, servers, virtual environments, websites, VoIP services – PRTG keeps an eye on your entire network.
Everyone has different monitoring needs. That’s why we let you try PRTG for free.