Custom alerts and data visualization let you quickly identify and prevent downtime and resource bottlenecks.
Running a VMware ESXi environment means managing multiple virtual machines, monitoring resource usage and preventing performance bottlenecks. Without the right monitoring tool, identifying problems across hosts, vCenter and data stores can be challenging. Paessler PRTG gives you a clear view of your entire virtual infrastructure, ensuring you can identify problems before they impact business operations. With real-time performance data and automated alerts, you can optimize workloads and ensure stability. PRTG provides the insight needed to keep VMware environments efficient, secure and reliable.
PRTG tracks key performance metrics such as CPU utilization, memory allocation and data store capacity. You can monitor ESXi hosts, virtual machines and vCenter from a single dashboard. Customizable views allow you to focus on the most critical aspects of your VMware environment.
Instant notification helps you react to performance problems before they cause downtime. PRTG provides threshold-based alerts via email, push notifications or third-party integrations. You can set escalation rules to prioritize urgent issues and automate responses.
PRTG generates reports on performance trends, resource utilization and hardware health. Customizable templates allow you to analyze long-term data and optimize your infrastructure. Scheduled reports help you make data-driven decisions to improve efficiency.
PRTG connects to vSphere, VMware Tools and SNMP to collect accurate performance data. API support allows you to integrate monitoring with other IT management systems. Compatibility with industry standard protocols ensures flexibility in diverse IT environments.
Diagnose network issues by continuously tracking VMware ESXi resource utilization. Show hardware health, virtual machine load, network traffic and other key metrics in real time. Visualize monitoring data in clear graphs and dashboards to identify problems more easily. Gain the overview you need to troubleshoot performance slowdowns.

Live traffic data graph in PRTG

Device tree view of the complete monitoring setup
Custom PRTG dashboard for keeping an eye on the virtual infrastructure
Live traffic data graph in PRTG
Device tree view of the complete monitoring setup
“All-around winning
network monitor”
“The real beauty of PRTG is the endless possibilities it offers”
“PRTG Network Monitor
is very hard to beat”
Managing a VMware ESXi environment can quickly become overwhelming. Virtual machines consume more resources than expected, data store usage spikes without warning, and performance bottlenecks slow down critical applications. Without proper monitoring, small issues can escalate into major outages. With PRTG, you always stay ahead of these problems by getting real-time insights, automated alerts, and reliable support whenever you need it.
Choose a licensing model that fits your needs-whether for a small setup or an enterprise-scale data center. Easily scale PRTG as your virtual environment grows. No hidden costs-just transparent pricing based on your needs.
Get started in minutes with pre-configured sensors for VMware ESXi. No complex scripts or manual configuration required - just connect PRTG to vCenter and start monitoring. Even without deep VMware knowledge, you can easily monitor your virtual infrastructure.
Get expert help when you need it, whether through documentation, our knowledge base, or direct contact with our support team. Get quick answers to technical questions and best practices to optimize your VMware monitoring. You're never left alone with problems.
Monitor your ESXi environment with encrypted connections and role-based access control. Restrict permissions based on user roles to prevent unauthorized changes. Keep your virtual machines and sensitive data protected at all times.
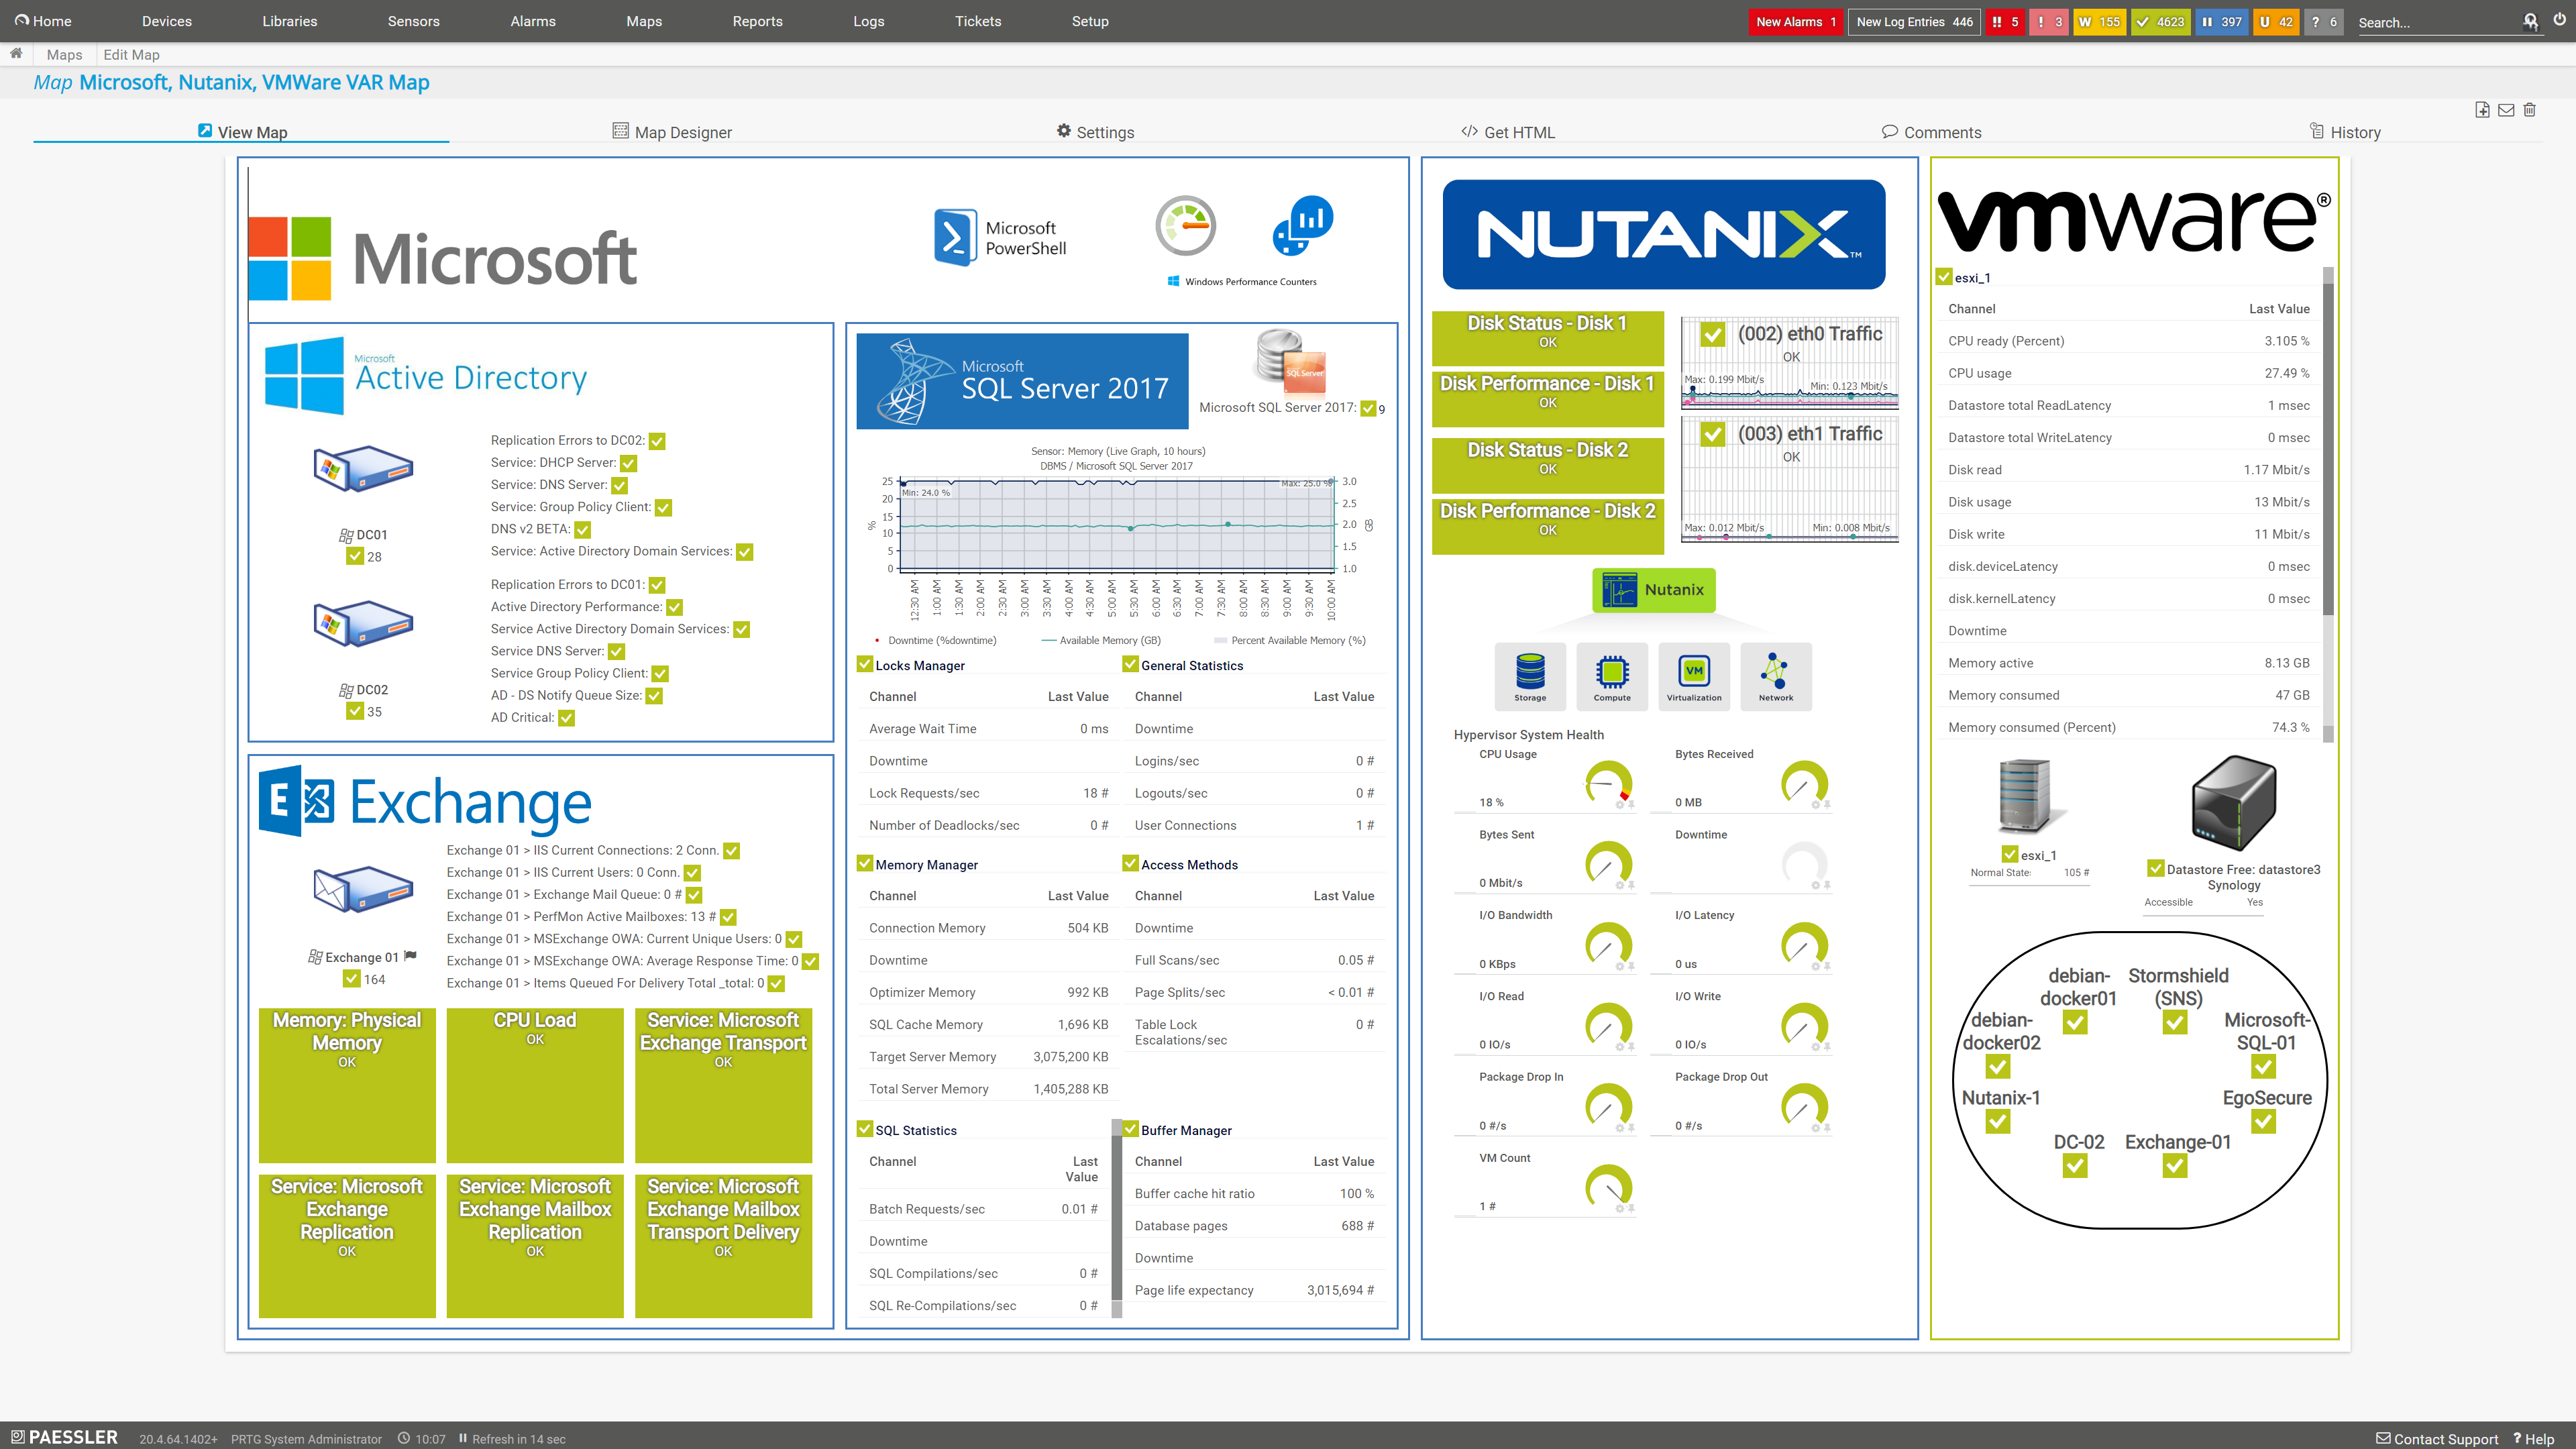
PRTG comes with more than 250 native sensor types for monitoring your entire on-premises, cloud, and hybrid cloud environment out of the box. Check out some examples below!
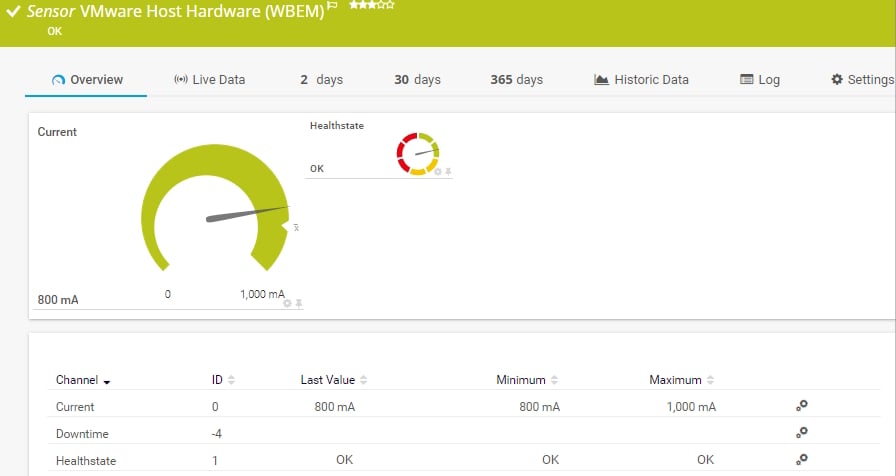
The VMware Host Hardware (WBEM) sensor monitors information about the hardware of an ESXi server using Web-based Enterprise Management (WBEM). It can show the following:
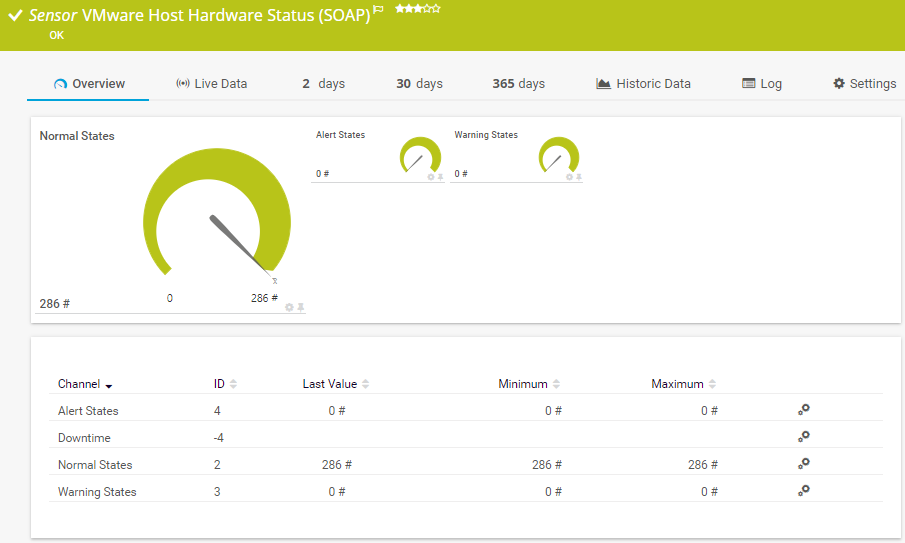
The VMware Host Hardware Status (SOAP) sensor monitors the hardware status of a VMware host server using the Simple Object Access Protocol (SOAP). It gives you a general status overview of the host. It can show the following:
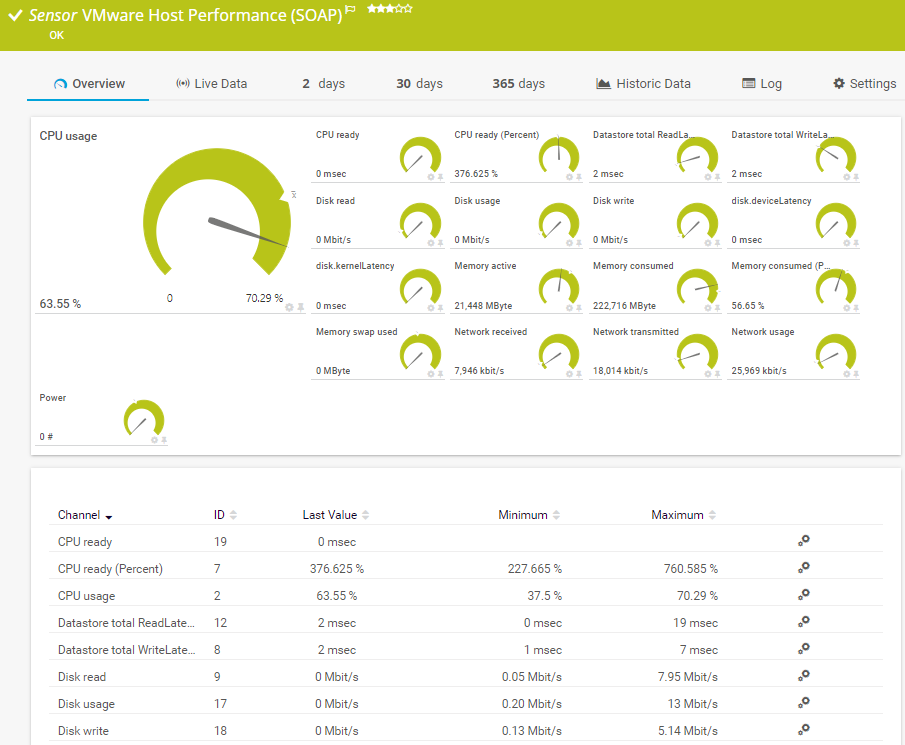
The VMware Host Performance (SOAP) sensor monitors a VMware host server using the Simple Object Access Protocol (SOAP). It can show the following and more:
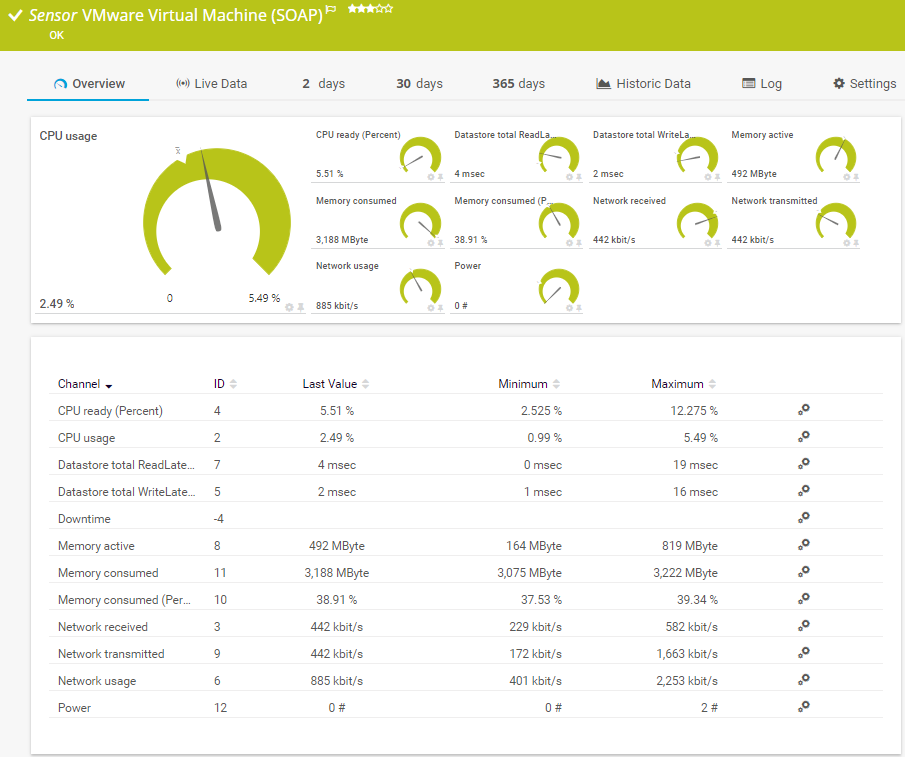
The VMware Virtual Machine (SOAP) sensor monitors a virtual machine (VM) on a VMware host server using the Simple Object Access Protocol (SOAP). It can show the following and more:
CPU readiness and usage
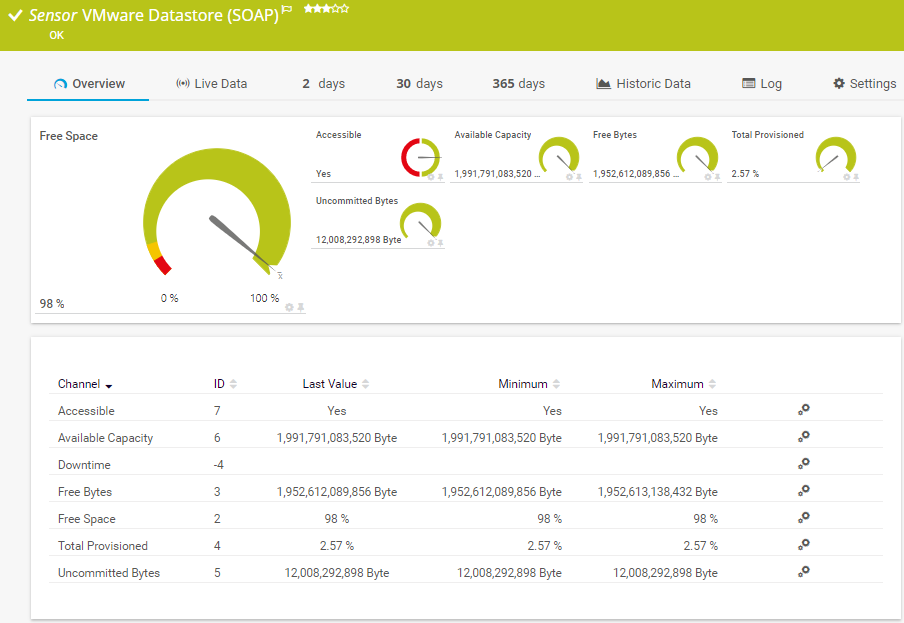
The VMware Datastore (SOAP) sensor monitors the disk usage of a VMware datastore using the Simple Object Access Protocol (SOAP). It can show the following:
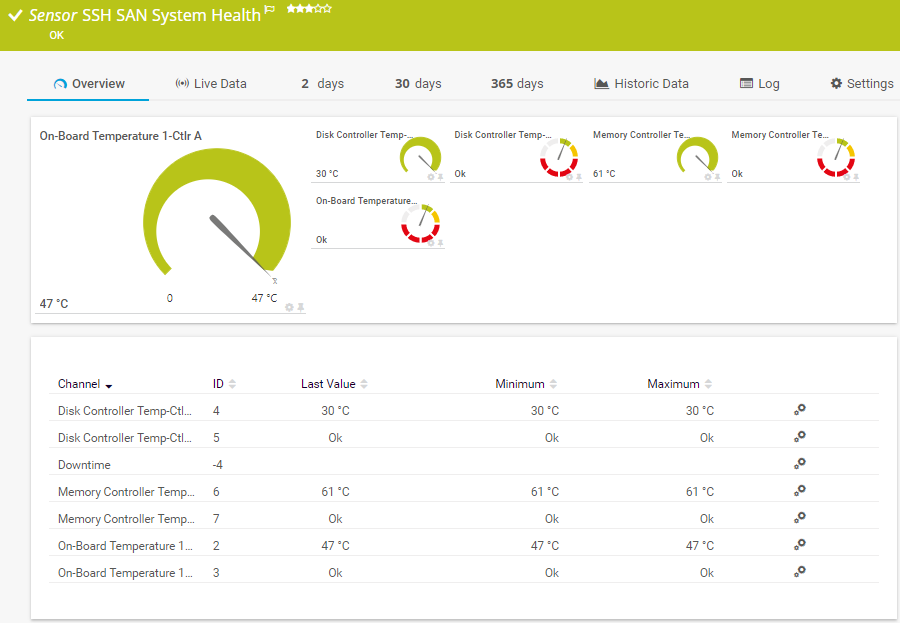
The SSH SAN System Health sensor monitors the system health of a storage area network (SAN) via Secure Shell (SSH). It can show the following:
See the PRTG Manual for a list of all available sensor types.

Custom alerts and data visualization let you quickly identify and prevent downtime and resource bottlenecks.
PRTG is set up in a matter of minutes and can be used on a wide variety of mobile devices.

Paessler achieved VMware's highest level of endorsement due to our technological excellence, leading market position, and superior compatibility with VMware products.
What does this mean for you?
Partnering with innovative IT vendors, Paessler unleashes synergies to create
new and additional benefits for joined customers.
IT that works constitutes a business-critical basis for a company's success. Availability and security must be defined for the respective purpose and closely monitored – by OT and IT alike.

baramundi and PRTG create a secure, reliable and powerful IT infrastructure where you have everything under control - from the traffic in your firewall to the configuration of your clients.
Integrating monitoring results from PRTG into NetBrain maps makes the foundation for network automation.
Real-time notifications mean faster troubleshooting so that you can act before more serious issues occur.
Network Monitoring Software – Version 25.1.104.1946 (March 18th, 2025)
Download for Windows and cloud-based version PRTG Hosted Monitor available
English, German, Spanish, French, Portuguese, Dutch, Russian, Japanese, and Simplified Chinese
Network devices, bandwidth, servers, applications, virtual environments, remote systems, IoT, and more
Choose the PRTG Network Monitor subscription that's best for you
A VMware ESXi monitoring tool tracks the performance and health of ESXi hypervisor servers, virtual machines, and the underlying virtualization infrastructure. It provides real-time insights into CPU usage, memory allocation, network traffic, and data store capacity. With the right tool, you can detect performance issues, monitor VMware vSphere environments, and optimize virtual machine workloads to ensure stability and efficiency.
Performance monitoring is essential to prevent resource bottlenecks and maintain a stable ESXi server. Without proper monitoring, virtual machines can consume excessive CPU and memory, resulting in slow response times and system failures. By continuously tracking metrics such as CPU usage, disk performance, and vSphere client activity, you can identify and resolve problems before they impact business operations.
PRTG integrates with VMware ESXi and vCenter Server to provide a complete overview of your virtual infrastructure. It collects data about VMware hosts, virtual disks, network activity and resource allocation. PRTG also supports SNMP, SSH and API-based monitoring to track health status, authentication attempts and hardware failures. Automated alerts notify you of potential problems, helping you maintain uptime and prevent performance degradation.
Yes, PRTG supports vSphere monitoring and can track guest operating systems running on VMware ESXi hosts. It monitors virtual machines for resource usage, disk activity and network performance. You can see detailed statistics about operating system processes, memory consumption and software applications (apps) running on each virtual machine. This helps you optimize workloads and avoid unnecessary resource allocation.
PRTG increases security by monitoring authentication logs, firewall activity and IP address access to your ESXi environment. It detects failed login attempts, monitors VMware ESX host connections and ensures that only authorized users access critical systems. With role-based permissions and encrypted data transmission, PRTG helps protect your virtualization infrastructure from unauthorized access and cyber threats.
Yes, PRTG continuously monitors the health of ESXi servers and VMware hosts. It tracks power conditions, fan speeds, and temperature sensors to detect hardware malfunctions. The built-in watchdog functionality identifies critical failures and can trigger automatic actions such as sending notifications or performing a controlled reboot to prevent downtime.
PRTG provides detailed real-time and historical performance data to help diagnose VMware ESXi problems. It visualizes CPU utilization, virtual disk performance and network bottlenecks in easy-to-read dashboards. With automated alerts, log tracking and remote monitoring via SSH, you can quickly pinpoint and resolve problems in your ESXi environment. PRTG also generates reports to help optimize resource allocation and improve system efficiency over time.
In PRTG, “sensors” are the basic monitoring elements. One sensor usually monitors one measured value in your network, for example the traffic of a switch port, the CPU load of a server, or the free space on a disk drive. On average, you need about 5-10 sensors per device or one sensor per switch port.
Paessler conducted trials in over 600 IT departments worldwide to tune its network monitoring software closer to the needs of sysadmins. The result of the survey: over 95% of the participants would recommend PRTG – or already have.

Paessler PRTG is used by companies of all sizes. Sysadmins love PRTG because it makes their job a whole lot easier.
Bandwidth, servers, virtual environments, websites, VoIP services – PRTG keeps an eye on your entire network.
Everyone has different monitoring needs. That’s why we let you try PRTG for free.