Custom alerts and data visualization let you quickly identify and prevent low availability, high bandwidth use, downtime, and other network performance issues.
Monitoring traffic in real time can be tricky even on small networks.
But if you have distributed and virtualized traffic too, well… the challenge factor increases exponentially.
How do you set performance benchmarks in a scenario with so many moving parts? And how do you get a clear view of all the interdependencies that might impact your network's stability and performance?
Paessler PRTG solves these problems by gathering TCP data, TCP/IP data, and other critical metrics from across your network in one place, no matter how complex your setup.
Ideal whether you have a small on-premise network or a large infrastructure with data centers in multiple locations, it can monitor unlimited local, remote, and virtual devices, bringing critical system data together in one simple, intuitive interface you can access from anywhere, saving you time, effort, and headaches.
Diagnose network issues by continuously tracking web, email, DNS servers, databases, routers, switches, firewalls, and other hardware and software components. Show connection times, latency, network traffic, and other key metrics in real time. Visualize monitoring data in clear graphs and dashboards to identify problems more easily. Gain the overview you need to troubleshoot slow or failed connections, packet loss, and other network performance issues.

Live traffic data graph in PRTG

Device tree view of the complete monitoring setup

Custom PRTG dashboard for keeping an eye on the entire IT infrastructure
Live traffic data graph in PRTG
Device tree view of the complete monitoring setup
“All-around winning
network monitor”
“The real beauty of PRTG is the endless possibilities it offers”
“PRTG Network Monitor
is very hard to beat”
Easy to configure, and even easier to set up. Key in your preferred range of IP addresses and the automatic network discovery will detect connected devices and assign the right sensors. Each sensor is preconfigured, so it works out of the box. But you can customize its settings to suit.
You shouldn’t have to sift through terabytes of data to pinpoint issues. PRTG's monitoring dashboard brings together mission-critical data in one place, showing you what's going on in real time. And built-in automations alert you if there are issues, while you get on with other tasks.
Your performance monitoring data (and network) are in safe hands. PRTG uses SSL encryption and other tough network security measures, including access rights management, SQL injection and cross-site scripting attack protection, and automated logout and re-authentication.
A clear (and complete) picture of your network in one single monitoring environment – not just TCP monitoring, but also SNMP, ICMP, WMI, SSH, and other protocols, hardware, applications... you get the idea. PRTG simplifies your workflow, saves time, and gives you peace of mind.
PRTG comes with more than 250 native sensor types for monitoring your entire on-premises, cloud, and hybrid cloud environment out of the box. Check out some examples below!
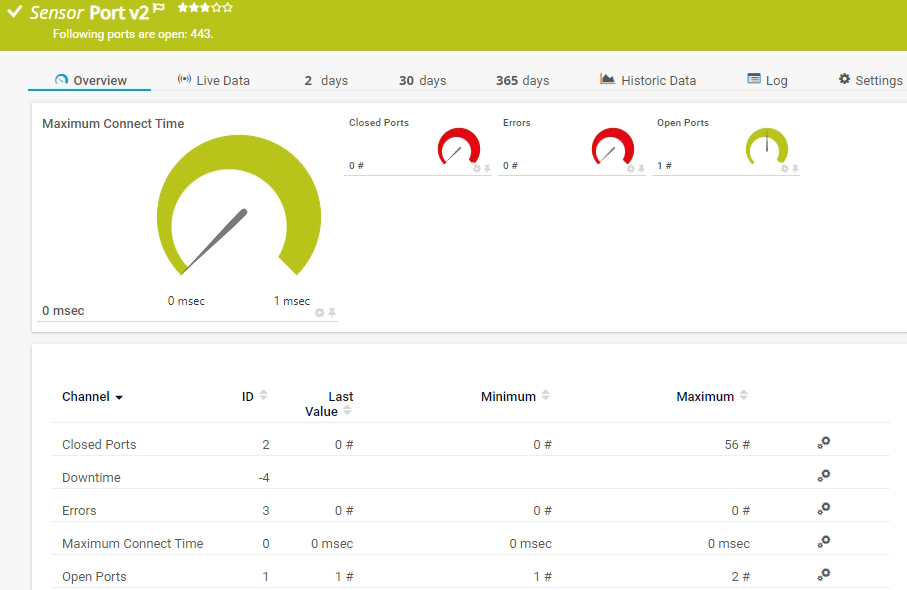
The Port v2 sensor monitors a network service by connecting to one or more of its TCP/IP ports. It can show the following:
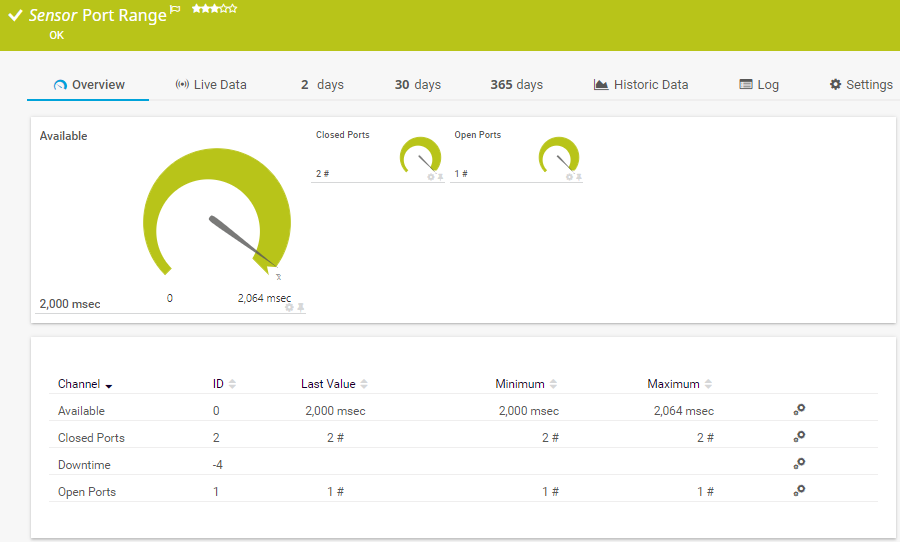
The Port Range sensor monitors a network service by connecting to various TCP/IP ports. It tries to connect to the specified TCP/IP port numbers of a device in succession and waits for the device to accept each request. It can show the following:
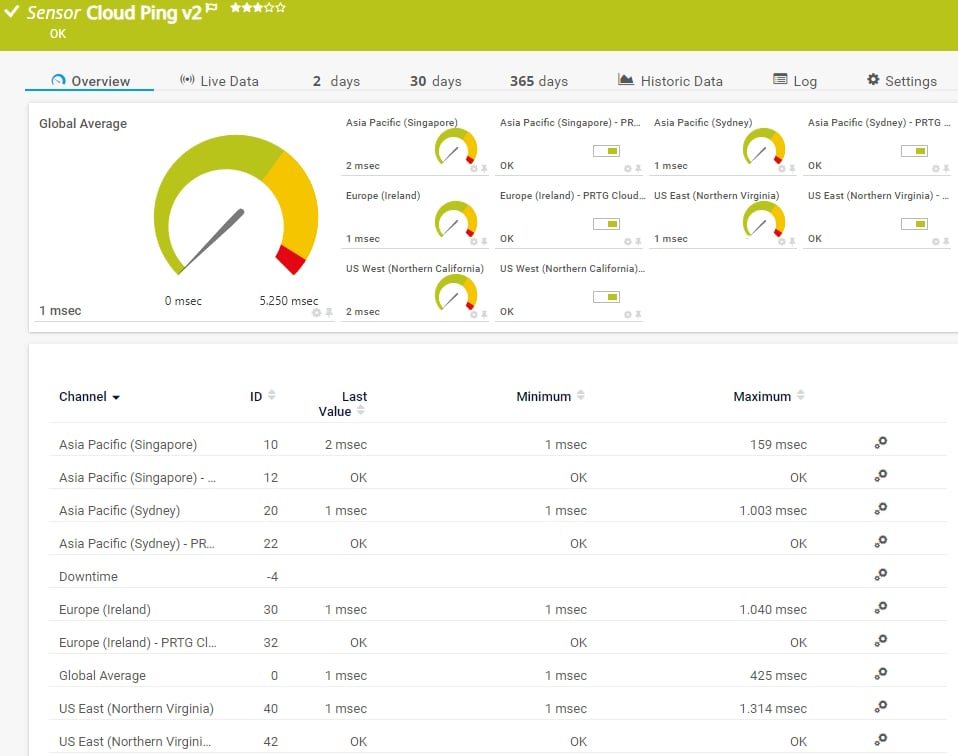
The Cloud Ping v2 sensor monitors the Transmission Control Protocol (TCP) ping times to its parent device from different locations worldwide (Asia Pacific: Singapore, Asia Pacific: Sydney, Europe: Ireland, US East: Northern Virginia, US West: Northern California) via the PRTG Cloud. It can show the following:
See the PRTG Manual for a list of all available sensor types.

Custom alerts and data visualization let you quickly identify and prevent low availability, high bandwidth use, downtime, and other network performance issues.
PRTG is set up in a matter of minutes and can be used on a wide variety of mobile devices.


“Excellent tool for detailed monitoring. Alarms and notifications work greatly. Equipment addition is straight forward and server initial setup is very easy. ...feel safe to purchase it if you intend to monitor a large networking landscape.”
Partnering with innovative IT vendors, Paessler unleashes synergies to create
new and additional benefits for joined customers.

Combining PRTG’s broad monitoring feature set with IP Fabric’s automated network assurance creates a new level of network visibility and reliability.

Paessler and Plixer provide a complete solution adding flow and metadata analysis to a powerful network monitoring tool.

With ScriptRunner Paessler integrates a powerful event automation platform into PRTG Network Monitor.
Real-time notifications mean faster troubleshooting so that you can act before more serious issues occur.
Network Monitoring Software – Version 24.4.102.1351 (November 12th, 2024)
Download for Windows and cloud-based version PRTG Hosted Monitor available
English, German, Spanish, French, Portuguese, Dutch, Russian, Japanese, and Simplified Chinese
Network devices, bandwidth, servers, applications, virtual environments, remote systems, IoT, and more
Choose the PRTG Network Monitor subscription that's best for you


TCP – Transmission Control Protocol – is a communication protocol that connects network devices to the internet, as well as intranets and extranets. Used by email services, FTP, SSH, streaming media, and other online applications, it tracks data and ensures efficient routing so it reaches the right device as quickly as possible.
TCP and UDP (User Datagram Protocol) are two fundamental communication protocols in the TCP/IP suite, but they differ significantly in how they handle data transmission.
TCP is connection-oriented. It establishes a connection between sender and receiver before transmitting data and ensures reliable communication through a handshake process. TCP also ensures reliable delivery, since it guarantees that data is delivered without errors, in the correct order, and without duplicates, and it retransmits lost or corrupted packets.
UDP, on the other hand, is connectionless. It does not establish a connection before sending data. Each packet (datagram) is sent independently without prior coordination. Moreover, delivery is unreliable, as UDP does not guarantee that packets are delivered, received in order, or free of errors and does not retransmit or acknowledge packets.
Three reasons.
First, to prevent problems and optimize performance. TCP monitoring enables you to check whether ports, devices, and services are open and responsive (and, if not, why), and to proactively detect and address issues – such as traffic spikes and latency – that might cause service disruptions.
Second, to improve network security. TCP doesn't encrypt data or protect connections from unauthorized access attacks. Real-time monitoring helps you detect suspicious activity and strengthen your defenses.
Third, for capacity planning. TCP monitoring data is a valuable source of information that can help you allocate resources more efficiently and update or upgrade your infrastructure so it keeps up with your organization's needs.
Connect a sensor close to the endpoint of the device you want to monitor and specify the TCP port and timeout value, then define the sensor behavior, for example whether it should show the status as "Up" when the port is open or closed. That's it. The sensor will keep a close eye on the TCP port and alert you if there are issue.
PRTG’s preconfigured TCP port-monitoring sensors can keep an eye on a single or multiple ports. If you're monitoring multiple TCP ports:
In PRTG, “sensors” are the basic monitoring elements. One sensor usually monitors one measured value in your network, for example the traffic of a switch port, the CPU load of a server, or the free space on a disk drive. On average, you need about 5-10 sensors per device or one sensor per switch port.
Paessler conducted trials in over 600 IT departments worldwide to tune its network monitoring software closer to the needs of sysadmins. The result of the survey: over 95% of the participants would recommend PRTG – or already have.

Paessler PRTG is used by companies of all sizes. Sysadmins love PRTG because it makes their job a whole lot easier.
Bandwidth, servers, virtual environments, websites, VoIP services – PRTG keeps an eye on your entire network.
Everyone has different monitoring needs. That’s why we let you try PRTG for free.