Custom alerts and data visualization let you quickly identify and prevent performance issues.
Your mainframe doesn’t exist in isolation; it’s reliant on the infrastructure around it. This means you need to include it in a holistic monitoring approach. With Paessler PRTG monitoring software, you get a complete overview of your entire IT infrastructure – including your z/OS systems and other mainframe environments.
Is network latency affecting mainframe transaction times? Are high mainframe transaction times or resource usage affecting network bandwidth? See the full picture in PRTG so you can correlate mainframe performance with overall IT health, improving observability across your infrastructure.
Reduce complexity and streamline IT workflows by monitoring everything from a single platform – mainframe systems, network devices, servers, applications, and more. PRTG offers you and your IT teams a single pane of glass to see it all, improving user experience and supporting the automation of routine tasks.
Solve problems fast and reduce outages using metrics from your mainframe and connected systems. Get to the root cause of performance issues, identify bottlenecks, and resolve problems by analyzing data from across your entire IT landscape.
Monitor critical mainframe performance metrics and receive real-time alerts when thresholds are exceeded. This allows for proactive intervention and minimizes downtime of your critical mainframe systems.
Diagnose network issues by continuously tracking mainframe metrics. Show network traffic and other key data in real time. Visualize monitoring data in clear graphs and dashboards to identify problems more easily. Gain the overview you need to troubleshoot mainframe issues.

Live traffic data graph in PRTG

Device tree view of the complete monitoring setup

Custom PRTG dashboard for keeping an eye on the entire IT infrastructure
Live traffic data graph in PRTG
Device tree view of the complete monitoring setup
“All-around winning
network monitor”
“The real beauty of PRTG is the endless possibilities it offers”
“PRTG Network Monitor
is very hard to beat”
PRTG uses SNMP to collect data from your mainframe, such as mainframe CPU usage, memory, and network traffic. To use this data in your monitoring strategy, enable SNMP on your mainframe and provide the community strings to PRTG.
Use scripting languages like PowerShell or Python in custom PRTG sensors to collect data from your mainframe or leverage APIs for enhanced monitoring capabilities. This gives you the flexibility to adjust your mainframe monitoring according to your specific environment and needs.
PRTG monitors the infrastructure surrounding the mainframe, including network devices, storage systems, and connected servers. This comprehensive performance monitoring helps you understand how mainframe activity impacts other systems, and vice versa, helps identify potential issues before they affect user experience.
PRTG comes with more than 250 native sensor types for monitoring your entire on-premises, cloud, and hybrid cloud environment out of the box. Check out some examples below!
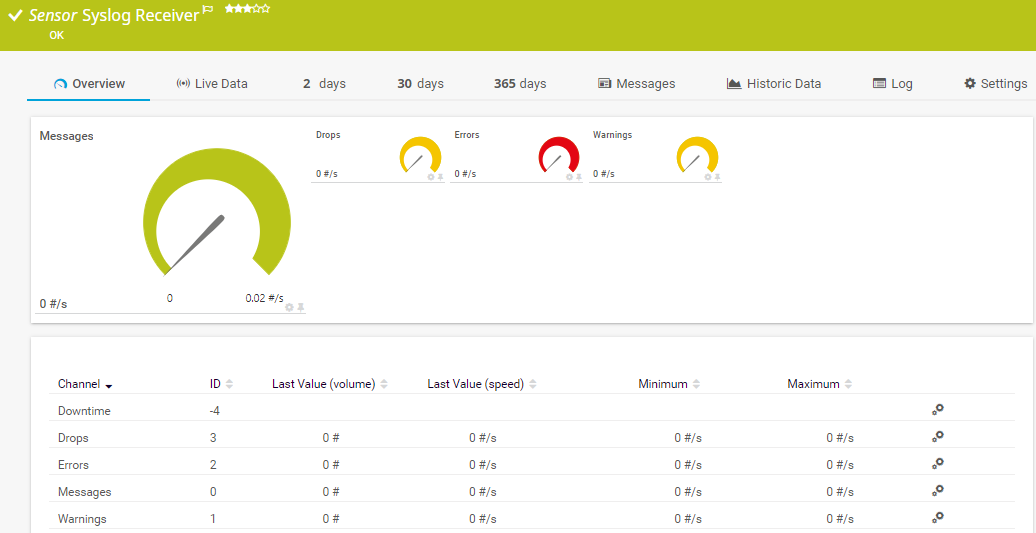
The Syslog Receiver sensor receives and analyzes Syslog messages. It can show the following:
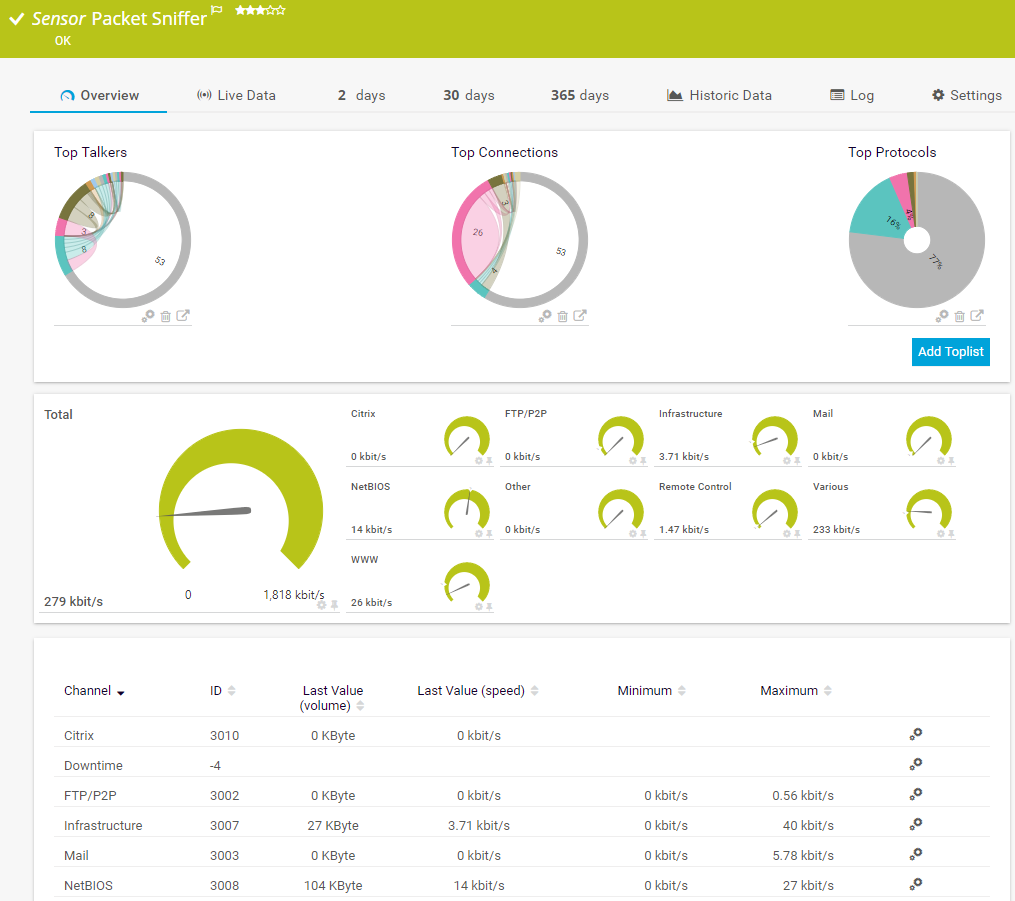
The Packet Sniffer sensor monitors the headers of data packets that pass a local network card using a built-in packet sniffer. You can choose from predefined channels. It can show the following and more:
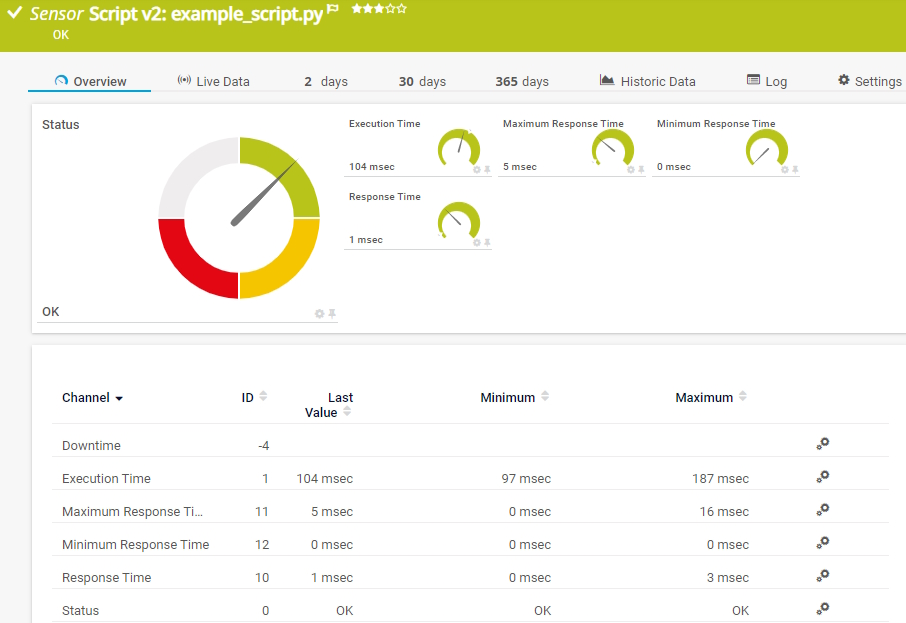
The Script v2 sensor runs a Python script (.py) on the probe system. It can show the following:
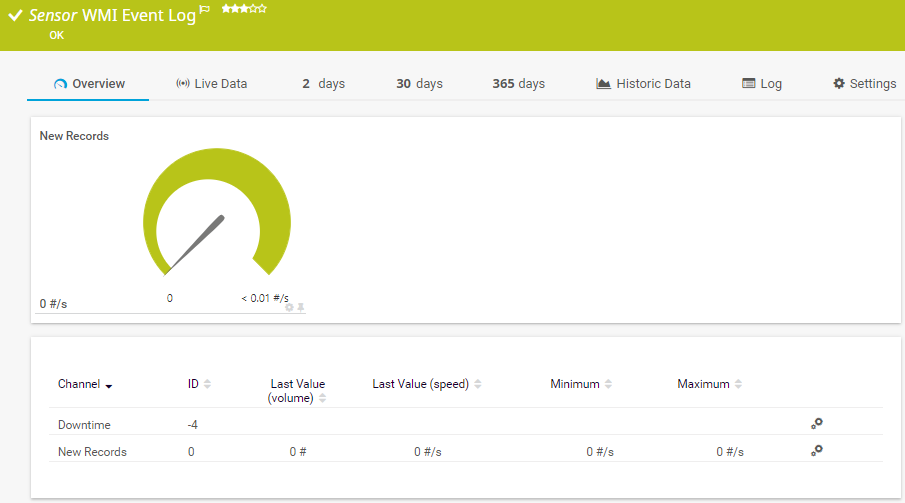
The WMI Event Log sensor monitors a Windows log file. It can show the following:
See the PRTG Manual for a list of all available sensor types.

Custom alerts and data visualization let you quickly identify and prevent performace issues.
PRTG is set up in a matter of minutes and can be used on a wide variety of mobile devices.


“Excellent tool for detailed monitoring. Alarms and notifications work greatly. Equipment addition is straight forward and server initial setup is very easy. ...feel safe to purchase it if you intend to monitor a large networking landscape.”
Partnering with innovative IT vendors, Paessler unleashes synergies to create
new and additional benefits for joined customers.
With the combination of PRTG and Insys, the monitoring specialist Paessler and the industrial gateway manufacturer INSYS icom offer a practical possibility to merge IT and OT.

Monitor all major physical hazards in IT rooms and racks such as critical climate factors, fire or burglary.

Paessler and Plixer provide a complete solution adding flow and metadata analysis to a powerful network monitoring tool.
Real-time notifications mean faster troubleshooting so that you can act before more serious issues occur.
Network Monitoring Software – Version 24.4.102.1351 (November 12th, 2024)
Download for Windows and cloud-based version PRTG Hosted Monitor available
English, German, Spanish, French, Portuguese, Dutch, Russian, Japanese, and Simplified Chinese
Network devices, bandwidth, servers, applications, virtual environments, remote systems, IoT, and more
Choose the PRTG Network Monitor subscription that's best for you
A mainframe is a high-performance computer system designed for large-scale tasks that demand high processing power, reliability, and security. They are typically used by large organizations like banks, airlines, and government agencies to handle massive data processing, transaction processing, and other demanding workloads. Mainframes are known for their robust architecture, continuous operation capabilities, and ability to handle millions of transactions per second, making them essential for applications where downtime is unacceptable. Leading examples of modern mainframes include the IBM Z and the Fujitsu BS2000 SE710 known for its high performance and scalability. Common mainframe operating systems include z/OS, which is optimized for high-volume transaction processing and resource management.
Absolutely! Monitoring your mainframe is key to making sure it's running smoothly, preventing costly downtime, and keeping your critical apps up and running. By tracking important metrics like CPU usage, memory, and response times, you can catch potential issues early, make sure you're using resources effectively, and keep your mainframe working for you reliably and efficiently. Monitoring also helps you meet service level agreements, keep your system secure, and get insights into how your system is doing overall.
While PRTG isn't a dedicated mainframe monitoring tool like some specialized solutions, it can definitely help you keep an eye on your mainframe environment. PRTG can use SNMP to gather metrics like mainframe CPU usage and network traffic. You can also use custom scripts, plugins, and API to collect specific data points and keep an eye on the surrounding infrastructure (network devices, storage, connected servers) to get insights into mainframe performance. This lets you integrate mainframe monitoring into a broader, holistic view of your IT infrastructure, all within a single platform.
In PRTG, “sensors” are the basic monitoring elements. One sensor usually monitors one measured value in your network, for example the traffic of a switch port, the CPU load of a server, or the free space on a disk drive. On average, you need about 5-10 sensors per device or one sensor per switch port.
Paessler conducted trials in over 600 IT departments worldwide to tune its network monitoring software closer to the needs of sysadmins. The result of the survey: over 95% of the participants would recommend PRTG – or already have.

Paessler PRTG is used by companies of all sizes. Sysadmins love PRTG because it makes their job a whole lot easier.
Bandwidth, servers, virtual environments, websites, VoIP services – PRTG keeps an eye on your entire network.
Everyone has different monitoring needs. That’s why we let you try PRTG for free.