Custom alerts and data visualizations let you quickly identify and prevent latency, packet loss, duplicate packets, and other causes of poor network performance.
When it comes to ensuring your network is stable and secure, the devil is in the details. Which is why packet analysis is the network administrator's best friend (well, that and coffee… lots of coffee).
But, with potentially several thousands of gigabytes passing through your network every single day, where do you even start looking to make sure everything's working as it should?
How do you sift through each variable and zoom in on potential threats, before your help desk phones start ringing off their hooks?
With PRTG network monitoring, that's not an issue.
Our intuitive packet capture tool can be configured in minutes, works with most major manufactures, and can be customized to suit. You'll also get alerted automatically when there are potential problems. Which means you can focus on more urgent tasks, safe in the knowledge that everything else is in hand.

No learning curve. No hassles. No sweat. PRTG’s automatic network discovery detects every device on your network and adds suitable sensors to it, so you can start capturing and analyzing traffic data and other performance metrics straight away.
Choose which network variables you want to track, and create your own dashboards via drag and drop for surgical monitoring and faster troubleshooting. Or generate custom reports that include exactly the level of detail you need the recipient to see, no matter if it’s an IT colleague or the management.
PRTG tracks and captures the packets flowing through your network over the long term. This makes it much easier to analyze network traffic, spot patterns and trends you might not pick up on otherwise, and proactively address issues before they have a noticeable impact on performance.
Cisco, Juniper Networks, Microsoft, Netgear... With more than 250 preconfigured sensor types, plus the ability to create your own, PRTG works with devices from most major manufacturers out of the box. Which means you can use one monitoring tool instead of spreading yourself all over the place.
Diagnose network issues by continuously tracking data packets. Show packet throughput, packet length, network traffic sources, potential security threats, and other key metrics in real time. Visualize monitoring data in clear graphs and dashboards to identify problems more easily. Gain the visibility you need to troubleshoot latency, packet loss issues, security loopholes, and other causes of poor network performance.
Preconfigured Packet Sniffer sensor in PRTG

Device tree view of the complete monitoring setup

Custom PRTG dashboard for keeping an eye on the entire IT infrastructure
Preconfigured Packet Sniffer sensor in PRTG
Device tree view of the complete monitoring setup
“All-around winning
network monitor”
“The real beauty of PRTG is the endless possibilities it offers”
“PRTG Network Monitor
is very hard to beat”
PRTG comes with more than 250 native sensor types for monitoring your entire on-premises, cloud, and hybrid cloud environment out of the box. Check out some examples below!
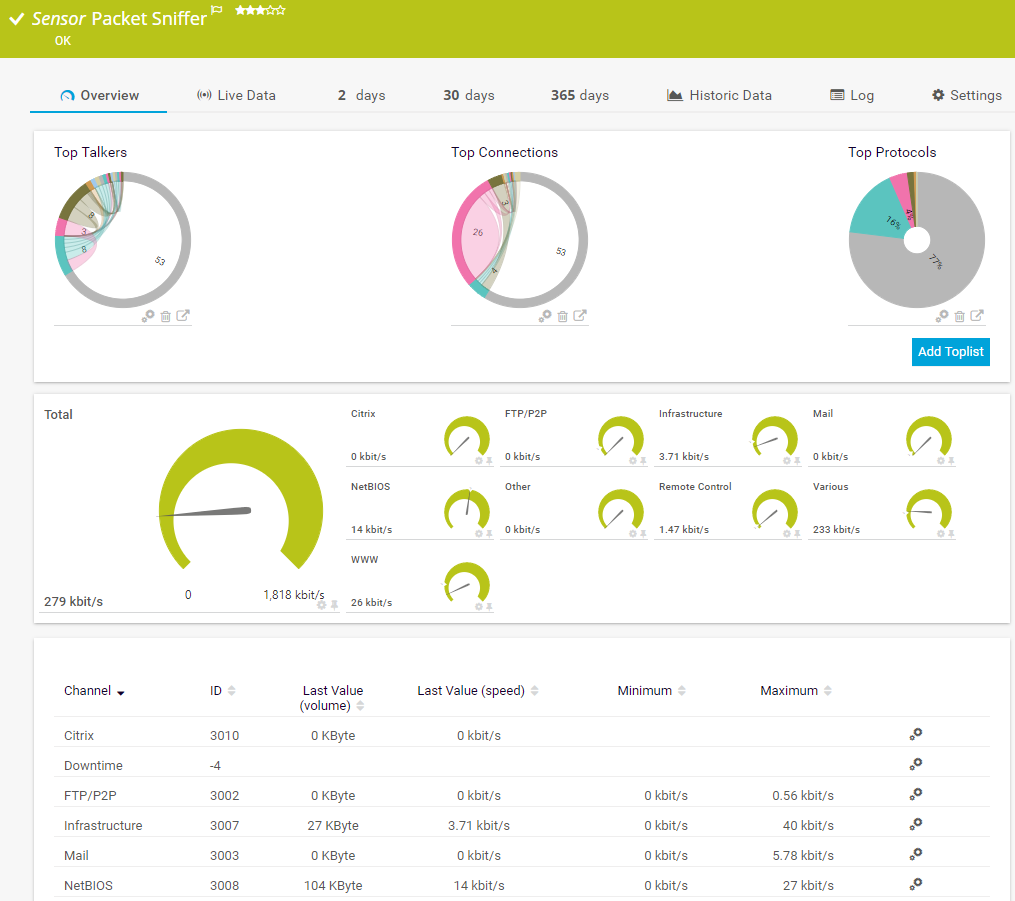
The Packet Sniffer sensor monitors the headers of data packets that pass a local network card using a built-in packet sniffer. You can choose from predefined channels. It can show the following and more:
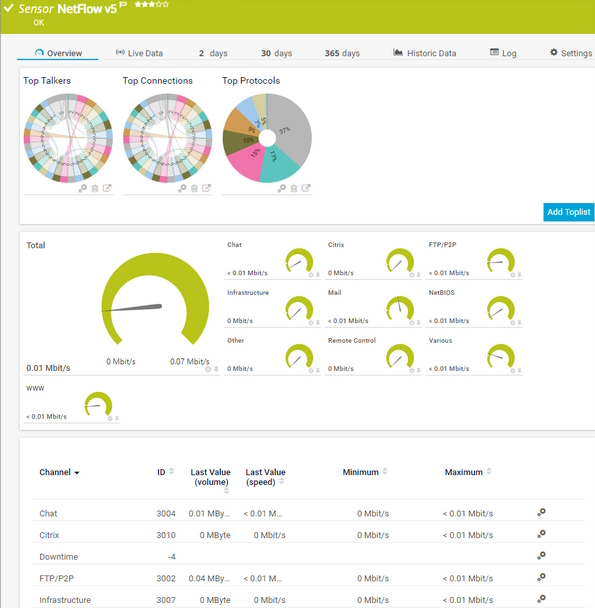
The NetFlow v5 sensor receives traffic data from a NetFlow v5-compatible device and shows the traffic by type. This sensor has several filter options to divide traffic into different channels. It can show the following and more:
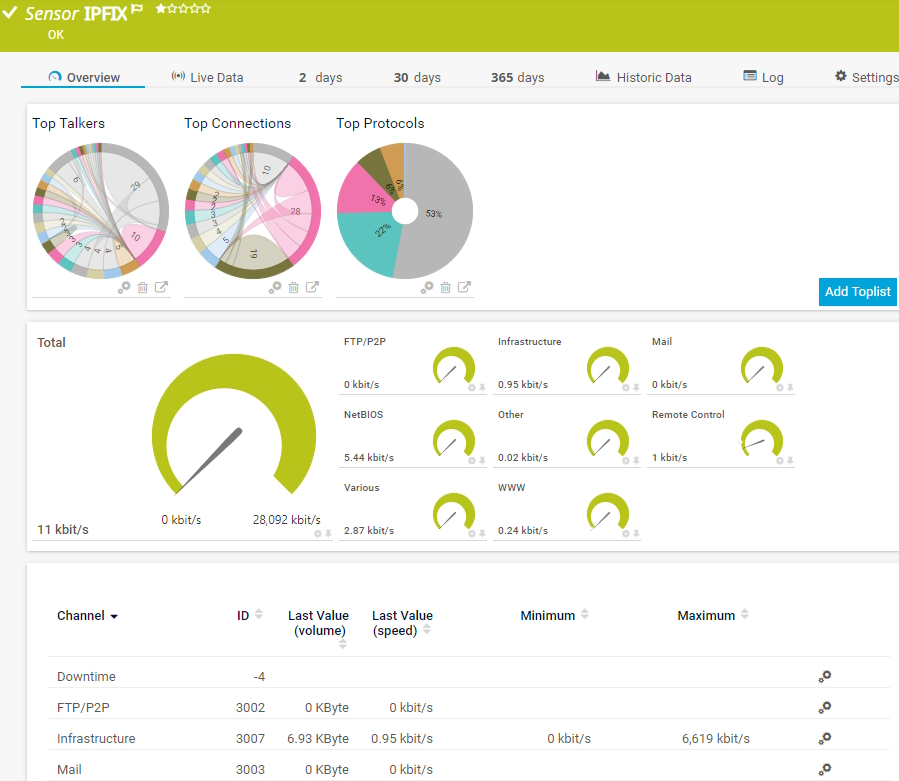
The IPFIX sensor receives traffic data from an Internet Protocol Flow Information Export (IPFIX) compatible device and shows traffic by type. It can show the following and more:
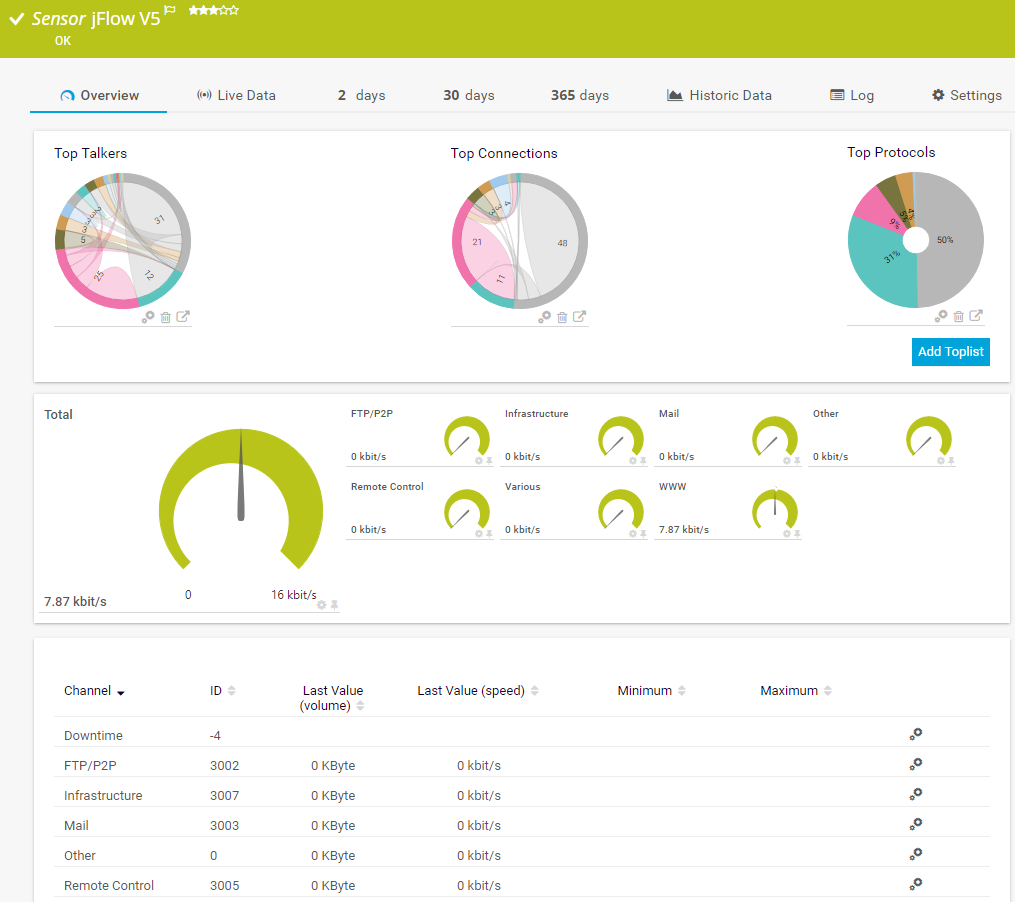
The jFlow v5 sensor receives traffic data from a jFlow v5-compatible device and shows the traffic by type. It can show the following and more:
See the PRTG Manual for a list of all available sensor types.

Custom alerts and data visualizations let you quickly identify and prevent latency, packet loss, duplicate packets, and other causes of poor network performance.
PRTG is set up in a matter of minutes and can be used on a wide variety of mobile devices.


“Excellent tool for detailed monitoring. Alarms and notifications work greatly. Equipment addition is straight forward and server initial setup is very easy. ...feel safe to purchase it if you intend to monitor a large networking landscape.”
Partnering with innovative IT vendors, Paessler unleashes synergies to create
new and additional benefits for joined customers.

Combining PRTG’s broad monitoring feature set with IP Fabric’s automated network assurance creates a new level of network visibility and reliability.

UVexplorer integrates tightly with PRTG to bring fast and accurate network discovery, detailed device inventory, and automatic network mapping to the PRTG platform.

Siemon and Paessler bring together intelligent building technology and advanced monitoring and make your vision of intelligent buildings and data centers become reality.
Real-time notifications mean faster troubleshooting so that you can act before more serious issues occur.
Network Monitoring Software – Version 24.4.102.1351 (November 12th, 2024)
Download for Windows and cloud-based version PRTG Hosted Monitor available
English, German, Spanish, French, Portuguese, Dutch, Russian, Japanese, and Simplified Chinese
Network devices, bandwidth, servers, applications, virtual environments, remote systems, IoT, and more
Choose the PRTG Network Monitor subscription that's best for you


Data packets make it possible for network data to be communicated via the Internet. They are sent via all the usual protocols. TCP packets are extremely reliable during the exchange of data, as errors are checked for and eventually removed. With UDP packets, the focus is on the quick exchange of data. PRTG monitors IP, TCP, and UDP packets, as well as other protocols.
Network packet capture means making copies of the data packets flowing through your network so you can review and analyze them. It's useful for spotting performance issues, identifying potential vulnerabilities, and helping you understand what might have caused network disruption, security breaches, or other incidents.
Because PRTG makes analyzing network traffic, and spotting (and fixing) issues much easier. Where Wireshark data is live and unfiltered, PRTG enables you to filter by variable. You can scan your network for potential problems, then get more granular should you spot something that doesn't look right. Which means you'll get to the bottom of an issue much more quickly.
The most common method is to connect PRTG to your routers' monitoring ports. Alternatively, send traffic from your router to PRTG and use sensors to capture the data packets. You can also capture data packets:
The basic difference between sFlow, NetFlow, IPFIX, and jFlow is that they use different methodologies to capture data:
If you want to monitor the traffic on your network without deep packet inspection, SNMP might be the technology of your choice.
In PRTG, “sensors” are the basic monitoring elements. One sensor usually monitors one measured value in your network, for example the traffic of a switch port, the CPU load of a server, or the free space on a disk drive. On average, you need about 5-10 sensors per device or one sensor per switch port.
Paessler conducted trials in over 600 IT departments worldwide to tune its network monitoring software closer to the needs of sysadmins. The result of the survey: over 95% of the participants would recommend PRTG – or already have.

Paessler PRTG is used by companies of all sizes. Sysadmins love PRTG because it makes their job a whole lot easier.
Bandwidth, servers, virtual environments, websites, VoIP services – PRTG keeps an eye on your entire network.
Everyone has different monitoring needs. That’s why we let you try PRTG for free.