Custom alerts and data visualization let you quickly identify and prevent duplicate packets, packet loss, and other issues.
When you lack visibility into your network traffic, resolving network congestion quickly is often just a dream. It can seem like a hodgepodge of shoring up network issues and identifying random root causes. Let our comprehensive, single-solution network monitoring software give you the peace of mind you need and deserve. Paessler PRTG’s packet analysis capabilities are always on and always alert.
Spot bandwidth bottlenecks and unusual traffic spikes faster than you can say “packet sniffer.”. Using advanced packet capture and packet sniffing techniques, PRTG helps you identify suspicious activities and other oddities that could indicate a potential security breach or network issue.
When something fishy happens, PRTG helps you pinpoint the problem down to the specific IP address. It’s like having X-ray vision for your network!
One size doesn’t fit all, especially when it comes to network monitoring in unique environments. PRTG’s extensive standard sensor types and powerful API allow you to customize sensors to fit your department’s unique needs.
Whether you’re focusing on packet analysis or real-time traffic monitoring using various flow protocols (NetFlow, jFlow, sFlow, IPFIX), you can set up PRTG to your heart’s content.
Stop juggling flaming torches. Simplify your life and your infrastructure monitoring with our all-encompassing software solution. PRTG simplifies your network monitoring by providing an all-in-one packet analyzer and packet sniffer.
With everything in one place, you can say goodbye to the circus act and hello to a more efficient, stress-free monitoring experience.
Your network deserves the best bodyguard your money can buy. PRTG’s rock-solid security measures ensure that all communications between the PRTG server, probes, and clients are secured via SSL/TLS.
Only the most secure ciphers for SSL/TLS connections are allowed, keeping your data and network traffic safe from prying eyes. Your monitoring data is safe, and so is your sanity.
Diagnose network issues by continuously tracking and analyzing the packets that flow through your network. Show response time, bandwidth usage, traffic by port, IP address, and other key metrics in real time. Visualize monitoring data in clear graphs and dashboards to identify problems more easily. Gain the overview you need to troubleshoot all kinds of packet inspection issues.

Live traffic data graph in PRTG

Device tree view of the complete monitoring setup

Custom PRTG dashboard for keeping an eye on the entire IT infrastructure
Live traffic data graph in PRTG
Device tree view of the complete monitoring setup
“All-around winning
network monitor”
“The real beauty of PRTG is the endless possibilities it offers”
“PRTG Network Monitor
is very hard to beat”
PRTG comes with more than 250 native sensor types for monitoring your entire on-premises, cloud, and hybrid cloud environment out of the box. Check out some examples below!
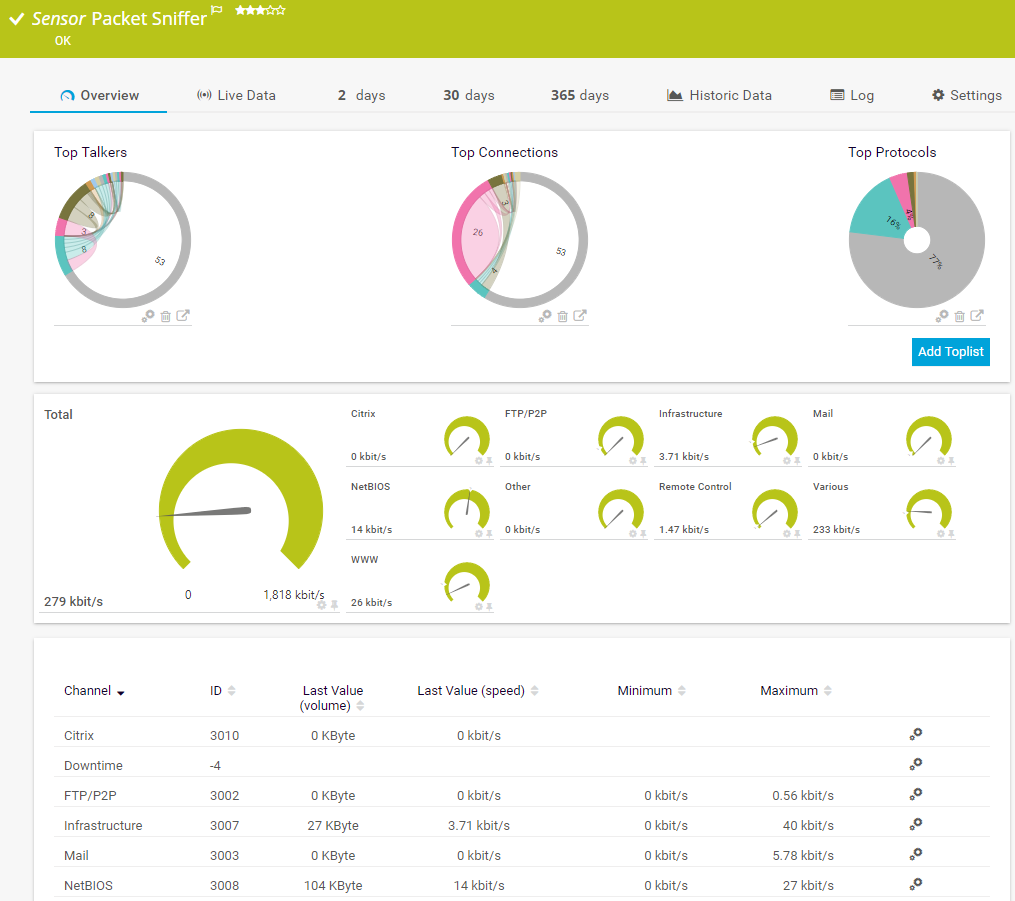
The Packet Sniffer sensor monitors the headers of data packets that pass a local network card using a built-in packet sniffer. You can choose from predefined channels. It can show the following and more:
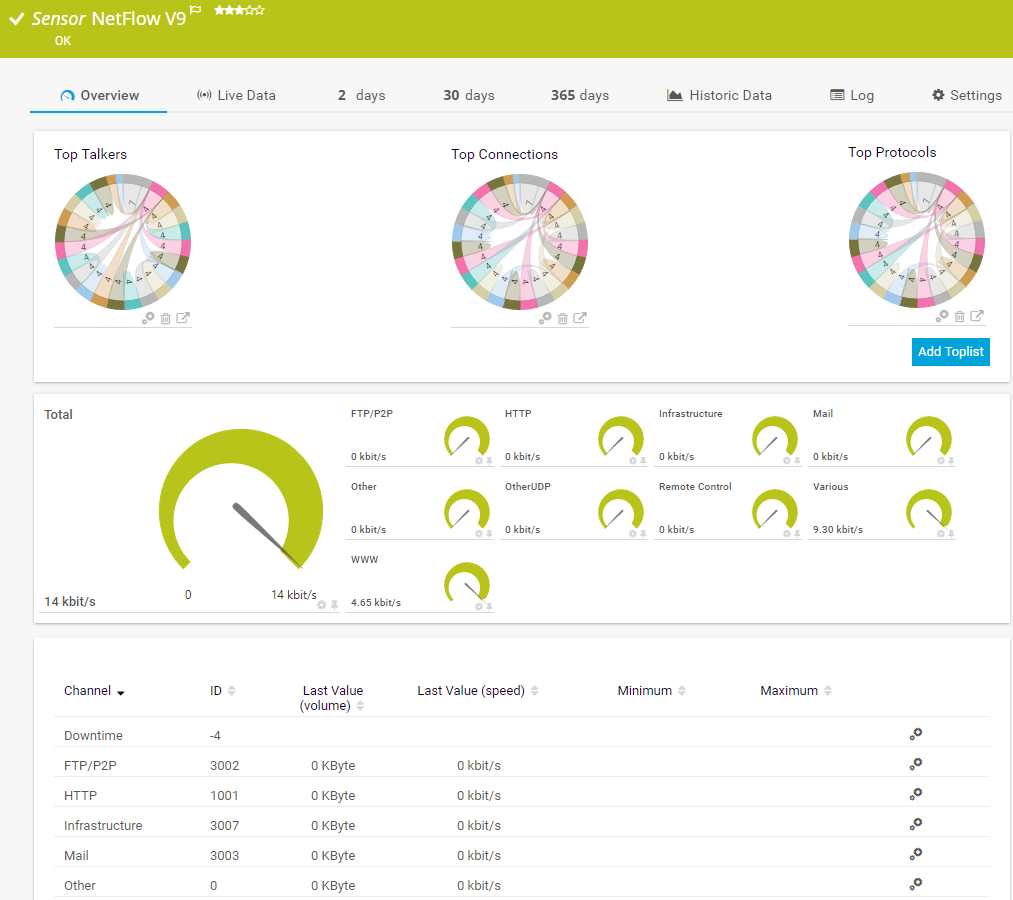
The NetFlow v9 sensor receives traffic data from a NetFlow v9-compatible device and shows the traffic by type. This sensor has several filter options to divide traffic into different channels. It can show the following and more:
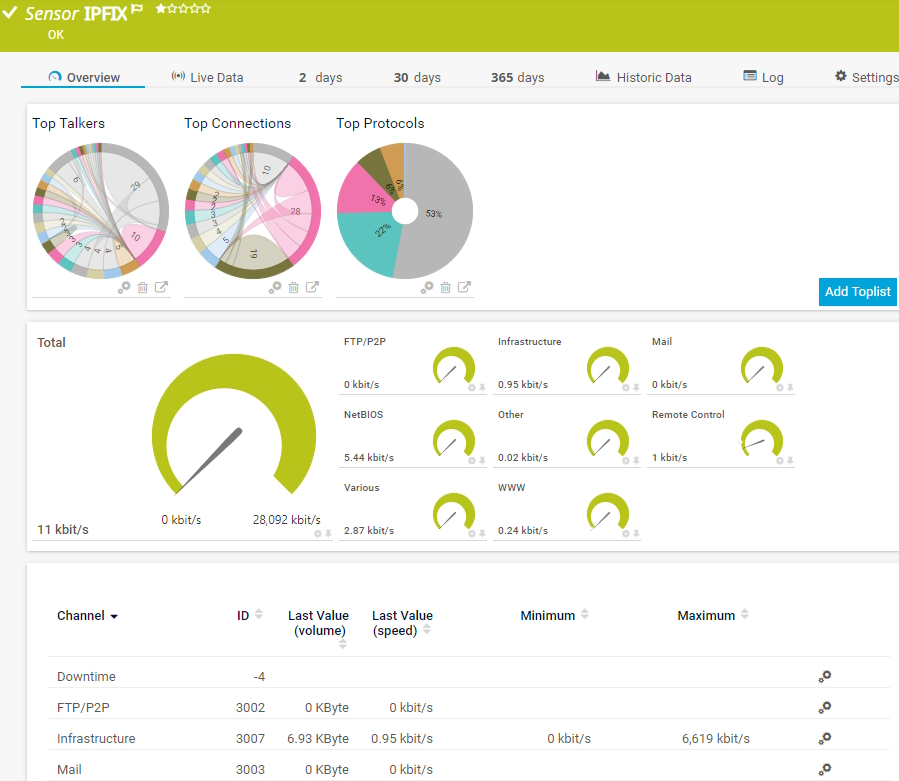
The IPFIX sensor receives traffic data from an Internet Protocol Flow Information Export (IPFIX) compatible device and shows traffic by type. It can show the following and more:
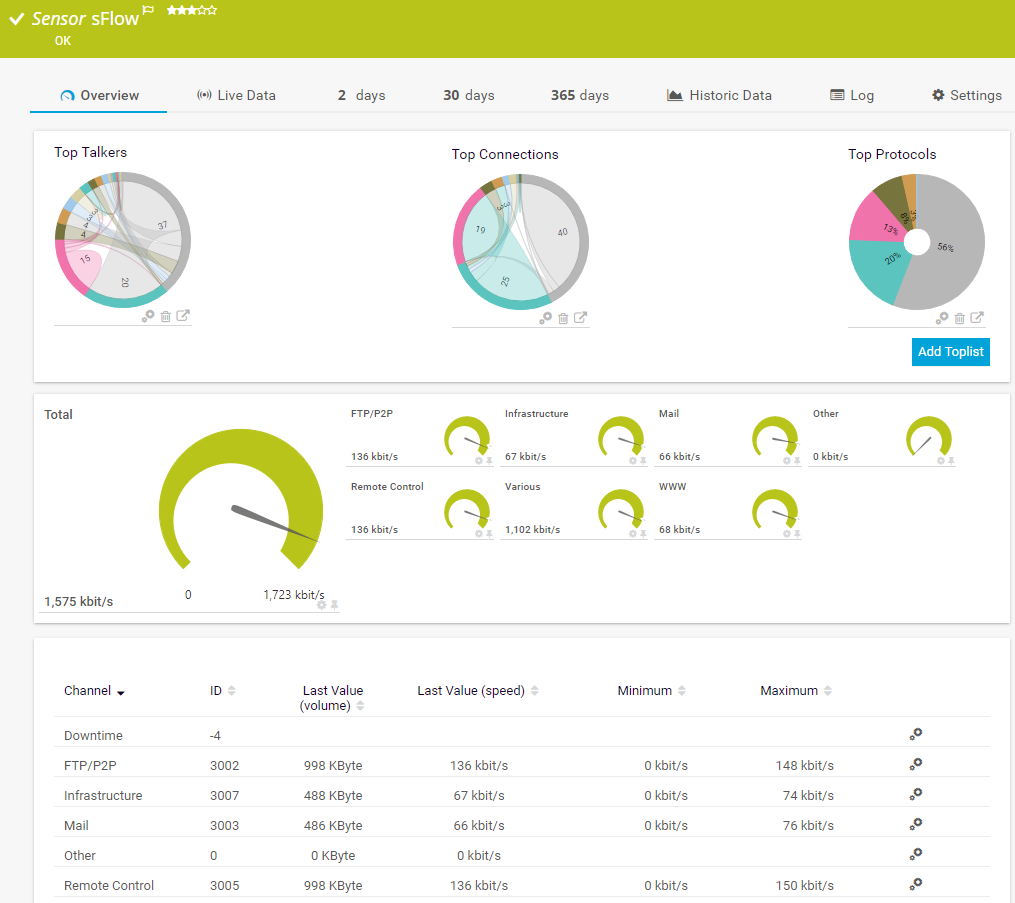
The sFlow sensor receives traffic data from an sFlow v5-compatible device and shows the traffic by type. This sensor has several filter options to divide traffic into different channels. It can show the following and more:
See the PRTG Manual for a list of all available sensor types.

Custom alerts and data visualization let you quickly identify and prevent duplicate packets, packet loss, and other issues.
PRTG is set up in a matter of minutes and can be used on a wide variety of mobile devices.


“Excellent tool for detailed monitoring. Alarms and notifications work greatly. Equipment addition is straight forward and server initial setup is very easy. ...feel safe to purchase it if you intend to monitor a large networking landscape.”
Partnering with innovative IT vendors, Paessler unleashes synergies to create
new and additional benefits for joined customers.
IT that works constitutes a business-critical basis for a company's success. Availability and security must be defined for the respective purpose and closely monitored – by OT and IT alike.
Integrating monitoring results from PRTG into NetBrain maps makes the foundation for network automation.

With ScriptRunner Paessler integrates a powerful event automation platform into PRTG Network Monitor.
Real-time notifications mean faster troubleshooting so that you can act before more serious issues occur.
Network Monitoring Software – Version 24.4.102.1351 (November 12th, 2024)
Download for Windows and cloud-based version PRTG Hosted Monitor available
English, German, Spanish, French, Portuguese, Dutch, Russian, Japanese, and Simplified Chinese
Network devices, bandwidth, servers, applications, virtual environments, remote systems, IoT, and more
Choose the PRTG Network Monitor subscription that's best for you


A packet analyzer, also known as a network analyzer, protocol analyzer, or sniffer, is a tool or software application that intercepts and analyzes data packets traveling over a network. It allows users to inspect, monitor, and troubleshoot network traffic in real-time or analyze it later from saved logs.
A packet analyzer is essential for understanding the detailed behavior of your network. It helps you diagnose network issues, enhance security, and ensure optimal performance by analyzing the data packets flowing through your network.
PRTG’s packet analyzer examines various aspects of network packets, including packet headers, payloads, protocols (such as TCP, DNS, and FTP), traffic patterns, and potential security threats. This detailed analysis helps in troubleshooting, optimizing performance, and identifying unauthorized activities.
PRTG uses advanced packet capture and packet sniffing techniques to gather data packets traversing the network. It then analyzes these packets to provide insights into traffic patterns, protocol usage, and potential issues. PRTG’s sensors are designed to capture and analyze data in real-time, offering a comprehensive view of network activity.
PRTG’s packet analyzer provides detailed packet capture, real-time packet sniffing, protocol-specific analysis, traffic pattern identification, and security threat detection. These features allow you to monitor network performance, debug issues, and enhance security.
Yes, PRTG stores historical data, allowing you to analyze packet trends over time and identify recurring issues. This historical data helps in long-term network planning and optimization.
In PRTG, “sensors” are the basic monitoring elements. One sensor usually monitors one measured value in your network, for example the traffic of a switch port, the CPU load of a server, or the free space on a disk drive. On average, you need about 5-10 sensors per device or one sensor per switch port.
Paessler conducted trials in over 600 IT departments worldwide to tune its network monitoring software closer to the needs of sysadmins. The result of the survey: over 95% of the participants would recommend PRTG – or already have.

Paessler PRTG is used by companies of all sizes. Sysadmins love PRTG because it makes their job a whole lot easier.
Bandwidth, servers, virtual environments, websites, VoIP services – PRTG keeps an eye on your entire network.
Everyone has different monitoring needs. That’s why we let you try PRTG for free.