![]()
Network Scanning Tool PRTG
Home in on network security and performance issues, fast
- Monitor all your network's key metrics from one place
- Customize your monitoring environment to suit
- Set up in minutes and get automatically alerted in case of issues
Our users give top ratings for monitoring with Paessler PRTG


PRTG network scanning tools: What you’ll find on this page

Keep your network running smoothly, and hackers at bay
Can you ever be 100% sure you're using network resources as efficiently as possible, and that there are no potential vulnerabilities bad actors could exploit?
No.
But with PRTG’s network scanning tools, you can have the next best thing: a constant eagle eye on every single metric that might impact your network’s performance, health and security.
And when we say constant, we mean 24 hours a day, seven days a week, 365 days a year (well, or 366, if it’s a leap year).
Packed with advanced features, and designed to be user-friendly and intuitive by default, PRTG’s sophisticated sensors track all your network devices’ critical metrics and alert you if something doesn’t look quite right, saving you time, effort, and giving you the peace of mind that you’ll always know about any issues before they cause disruption and unplanned downtime.
PRTG makes scanning your network easy
Custom alerts and data visualizations make it easy to monitor, identify, and prevent bottlenecks, unplanned downtime, service interruptions, suspicious activity, and other network performance and security issues.
A network administrator’s best friend: Why Paessler PRTG
Comprehensive monitoring functionality
A complete view of your network’s health and security at a glance. Stop wasting time and effort switching between different monitoring environments and get the visibility you need to maximize performance and plan ahead with confidence.
Proactive protection
Nip potential problems in the bud, and strengthen your organization’s cybersecurity. Once you pick your preferred thresholds, PRTG monitors everything round the clock, and built-in automations alert you if there are issues, so you can step in and fix them straight away.
Effortless customization
Tailor your monitoring environment to your exact needs. Create your own library of toplists and topology maps, bespoke charts, graphs, and dashboards, and reporting templates, and configure user-defined thresholds. You can even create custom monitoring sensors.
As user-friendly as it gets
Enter your chosen IP range, and Auto Discovery detects your network devices, assigns the right sensors, and starts monitoring. Job done. You don’t even have to customize or configure (unless you want to). One of PRTG’s key features is that it works right out of the box.
What network scanning looks like in PRTG
Diagnose network issues by continuously monitoring applications, routers, switches, servers, firewalls, cloud services, virtual machines, VoIP, and other network hardware and software. Show bandwidth, memory, traffic, latency, and other key stats in real time and visualize data in graphic maps & dashboards to identify problems more easily. Gain the visibility you need to troubleshoot bottlenecks, service interruptions, suspicious activity, and other network performance and security issues.

Device tree view of the complete monitoring setup
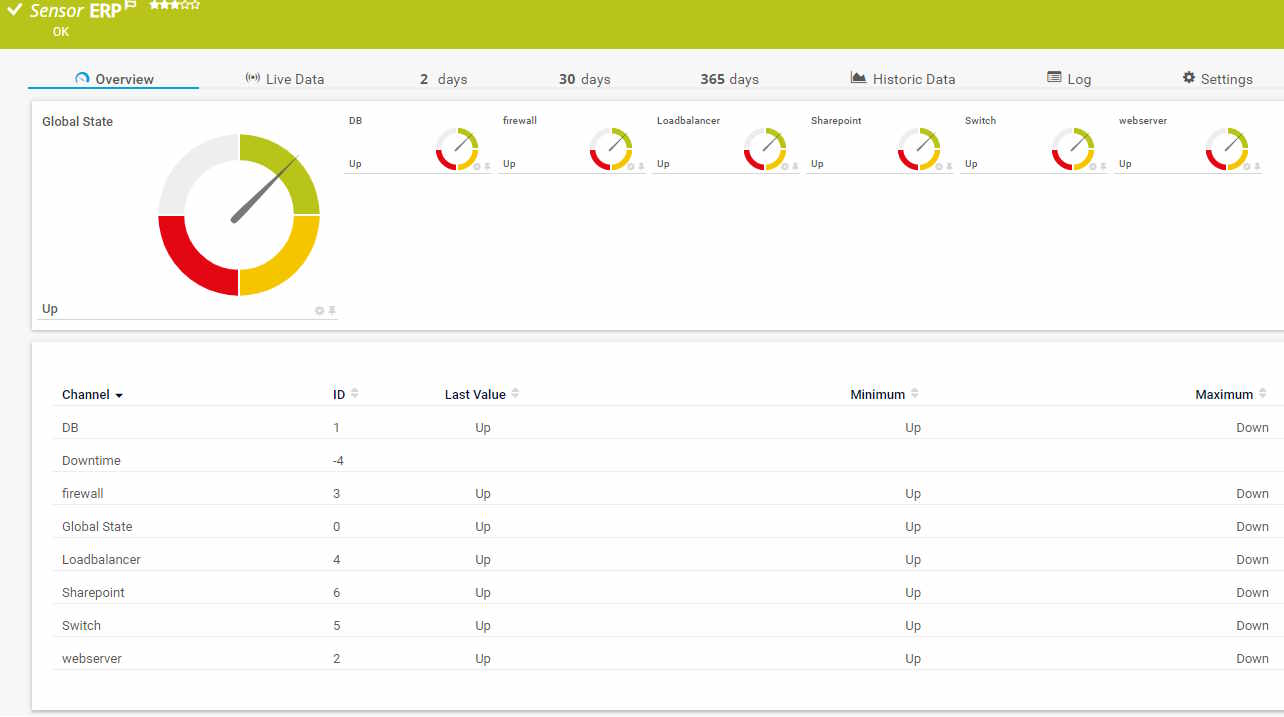
Custom Business Process sensor in PRTG

Custom PRTG dashboard for keeping an eye on the entire IT infrastructure
Start scanning your network with PRTG and see how it can make your network more reliable and your job easier.
IT experts agree: Paessler PRTG is a great solution for IT infrastructure monitoring

“All-around winning
network monitor”

“The real beauty of PRTG is the endless possibilities it offers”

“PRTG Network Monitor
is very hard to beat”
What metrics can PRTG’s network scanner keep an eye on?
Put simply, any metric imaginable. DNS. Firewalls. Operating systems. Port scanning. Routers and switches... you get the idea.
With 250 + preconfigured sensors plus the ability to create your own, and support for all major protocols — including WMI, SNMP, and packet-sniffing, and as well as flow technologies: NetFlow, IPFIX, jFlow, and sFlow — gives you a complete picture of your network, streamlining and taking the effort out of monitoring, troubleshooting, and vulnerability scanning and vulnerability assessments.
PRTG’s network scanning sensors include:
- Database-monitoring sensors, including for Microsoft SQL and MySQL
- LAN-monitoring sensors
- Network usage-monitoring sensors
- Ping, which monitors availability and response times
- Port scanner sensors, including sensors for monitoring TCP and UDP port status, bandwidth usage, potential vulnerabilities like open ports, and other key stats
- Server-monitoring sensors
- SNMP traffic, which monitors bandwidth use and data flows — useful for more efficient network management and security auditing
- SNMP and Windows CPU load
- Website-monitoring sensors
Your network's key stats at a glance – even on the go
Set up PRTG in minutes and use it on almost any mobile device.


Easily find the source of the problem with our PRTG network-scanning solution
Real-time alerts and custom notifications make it easy to solve issues such as bottlenecks, unplanned downtime, service interruptions, suspicious activity, and other network performance and security issues.
PRTG is compatible with all major vendors, products, and systems
![]()
Create innovative solutions with Paessler’s partners
Partnering with innovative vendors, Paessler unleashes synergies to create
new and additional benefits for joined customers.


ScriptRunner
With ScriptRunner, Paessler integrates a powerful event automation platform into PRTG Network Monitor.
“Excellent tool for detailed monitoring. Alarms and notifications work greatly. Equipment addition is straight forward and server initial setup is very easy. ...feel safe to purchase it if you intend to monitor a large networking landscape.”
Infrastructure and Operations Engineer in the Communications Industry, firm size 10B - 30B USD
PRTG makes scanning your network easy
Custom alerts and data visualizations make it easy to monitor, identify, and prevent bottlenecks, unplanned downtime, service interruptions, suspicious activity, and other network performance and security issues.

PRTG: The multi-tool for sysadmins
Adapt PRTG individually and dynamically to your needs and rely on a strong API:- HTTP API: Access monitoring data and manipulate monitoring objects via HTTP requests
- Custom sensors: Create your own PRTG sensors for customized monitoring
- Custom notifications: Create your own notifications and send action triggers to external systems
- REST Custom sensor: Monitor almost everything that provides data in XML or JSON format
We asked: would you recommend PRTG?
Over 95% of our customers say yes!
Paessler conducted trials in over 600 IT departments worldwide to tune its network monitoring software closer to the needs of sysadmins.
The result of the survey: over 95% of the participants would recommend PRTG – or already have.

Still not convinced?
![]()
More than 500,000
sysadmins love PRTG
Paessler PRTG is used by companies of all sizes. Sysadmins love PRTG because it makes their job a whole lot easier.
![]()
Monitor your entire IT infrastructure
Bandwidth, servers, virtual environments, websites, VoIP services – PRTG keeps an eye on your entire network.
![]()
Try Paessler PRTG
for free
Everyone has different monitoring needs. That’s why we let you try PRTG for free.
![]()
Start scanning your network with PRTG and see how it can make your network more reliable and your job easier.
|
PRTG |
Network Monitoring Software - Version 25.1.104.1961 (April 7th, 2025) |
|
Hosting |
Download for Windows and cloud-based version PRTG Hosted Monitor available |
Languages |
English, German, Spanish, French, Portuguese, Dutch, Russian, Japanese, and Simplified Chinese |
Pricing |
Up to 100 sensors for free (Price List) |
Unified Monitoring |
Network devices, bandwidth, servers, applications, virtual environments, remote systems, IoT, and more |
Supported Vendors & Applications |
|
Discover more monitoring insights and stories

Solutions for all your monitoring needs


Combining the broad monitoring feature set of PRTG with IP Fabric’s automated network assurance creates a new level of network visibility and reliability.