Custom alerts and data visualization let you quickly identify and prevent network downtime.
You want a smooth-running and highly available network. You keep a watchful eye - a hawk on the lookout for the slightest movement... Take some of the pressure off with Paessler PRTG, our complete network monitoring solution built to provide instant insights into anything out of the ordinary so you can troubleshoot effectively, ensuring less execution time and faster response time.
Quickly pinpoint network bottlenecks and unusually long response time without breaking a sweat. PRTG uses ICMP echo requests to ping IP addresses and diagnose availability issues as they happen, not after the fact.
Whether you’re dealing with high latency, jitter, or even downtime, our ping monitor software will give you the exact data you need to keep your network humming.
Stay calm and keep one step ahead of any problems with your network devices’ reachability. PRTG provides you with information on what is happening right now, displayed in easy-to-read dashboards.
And if there is a problem, you’ll be immediately alerted via customizable notifications per email, SMS, or push alerts – allowing you to quickly address any potential disruptions.
PRTG makes it simple to improve your network diagnostics efforts with its integrated traceroute functionality. Find out exactly where delays occur in the network path and fix them quickly and efficiently.
Track the journey of data packets from source to destination – it’s like a GPS for your data packets, showing you exactly where they are and how fast they are going.
Monitor your network, down to the bit, for potential security threats. By keeping a close eye on response times and network performance, you can spot and fix issues before they become a much bigger problem.
PRTG helps maintain a secure and reliable environment and simplifies network management. You can relax, knowing you have the information you need to protect your network from intruders.
Diagnose network issues by continuously tracking the availability and uptime of your network components. Show response time, latency, jitter, even packet loss, and other key performance metrics in real time. Visualize monitoring data in clear graphs and dashboards to identify problems more easily. Gain the overview you need to perform reliable ping tests and troubleshoot network problems.

Live traffic data graph in PRTG

Device tree view of the complete monitoring setup

Custom PRTG dashboard for keeping an eye on the entire IT infrastructure
Live traffic data graph in PRTG
Device tree view of the complete monitoring setup
“All-around winning
network monitor”
“The real beauty of PRTG is the endless possibilities it offers”
“PRTG Network Monitor
is very hard to beat”
PRTG comes with more than 250 native sensor types for monitoring your entire on-premises, cloud, and hybrid cloud environment out of the box. Check out some examples below!
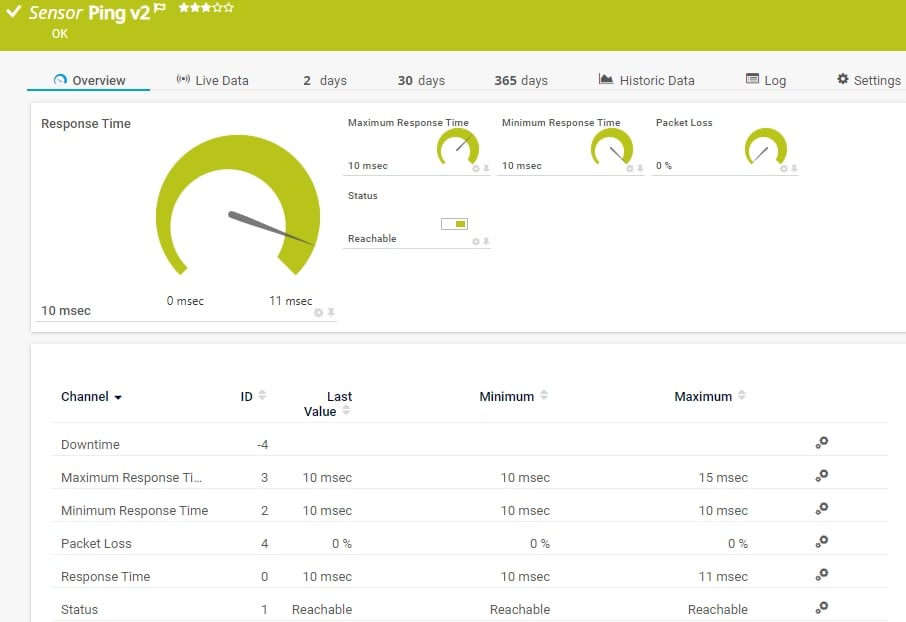
The Ping v2 sensor sends an Internet Control Message Protocol (ICMP) echo request ("ping") from the probe system to the parent device to monitor its availability. It can show the following:
• Response time
• Packet loss
• Target status
• Minimum and maximum ping time
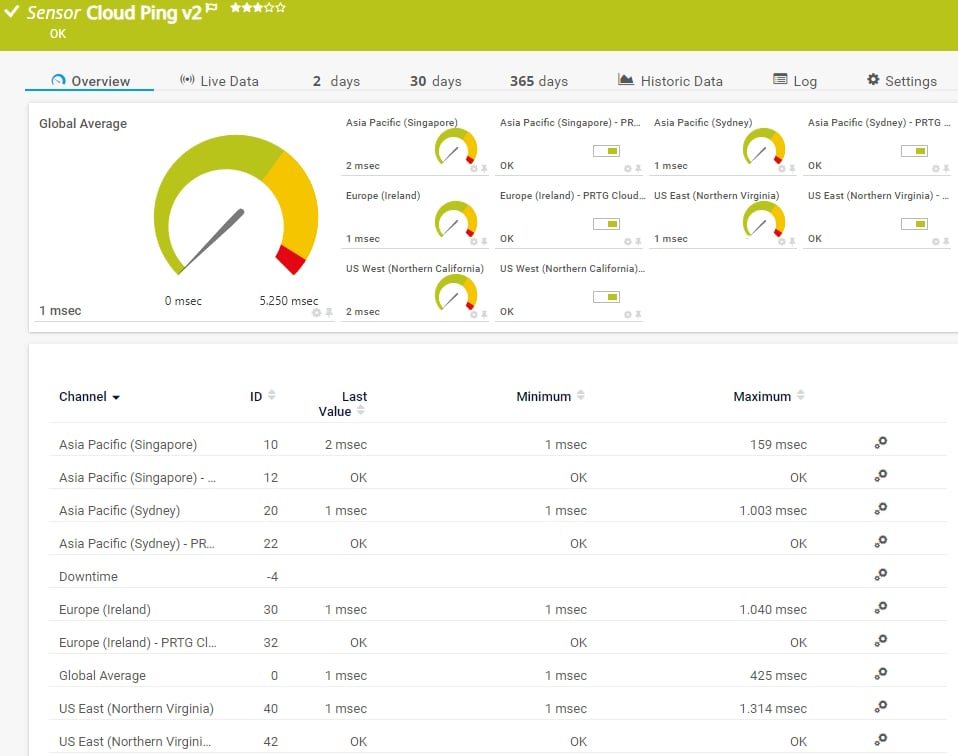
The Cloud Ping v2 sensor monitors the Transmission Control Protocol (TCP) ping times to its parent device from different locations worldwide (Asia Pacific: Singapore, Asia Pacific: Sydney, Europe: Ireland, US East: Northern Virginia, US West: Northern California) via the PRTG Cloud. It can show the following:
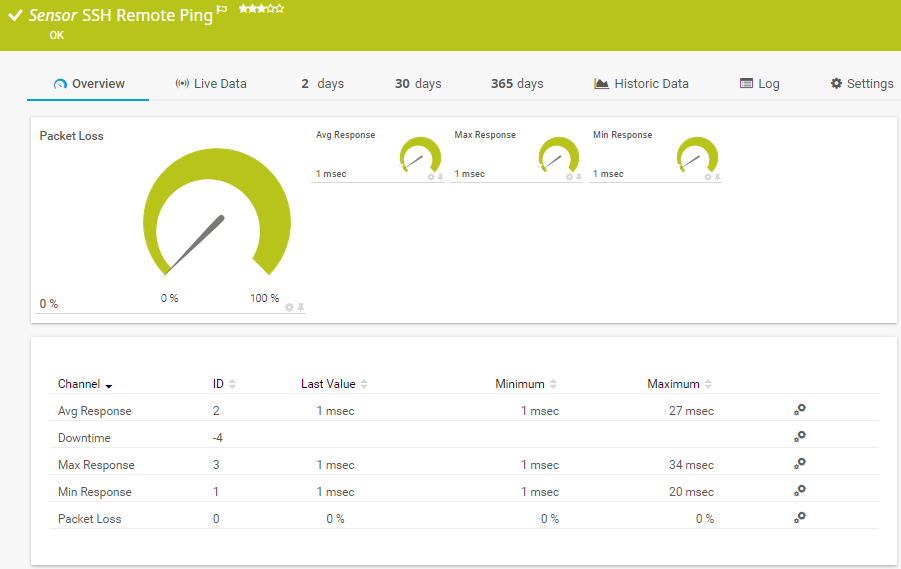
The SSH Remote Ping sensor remotely monitors the connectivity between a system running Linux/macOS X and another device, using Internet Control Message Protocol (ICMP) echo requests ("ping") and Secure Shell (SSH). It can show the following:
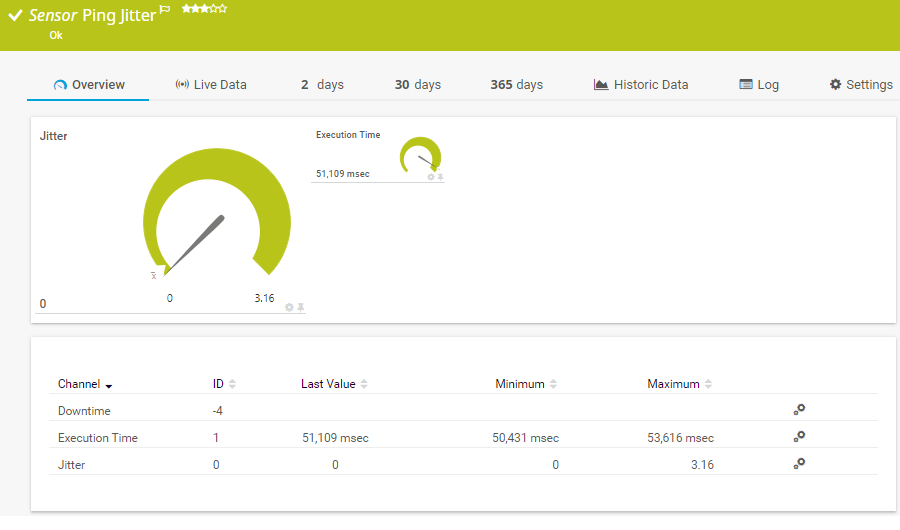
The Ping Jitter sensor sends a series of Internet Control Message Protocol (ICMP) echo requests ("pings") to a URI to determine the statistical jitter. It can show the following:
See the PRTG Manual for a list of all available sensor types.

Real-time notifications mean faster troubleshooting so that you can act before more serious issues occur.
PRTG is set up in a matter of minutes and can be used on a wide variety of mobile devices.


“Excellent tool for detailed monitoring. Alarms and notifications work greatly. Equipment addition is straight forward and server initial setup is very easy. ...feel safe to purchase it if you intend to monitor a large networking landscape.”
Partnering with innovative IT vendors, Paessler unleashes synergies to create
new and additional benefits for joined customers.
IT that works constitutes a business-critical basis for a company's success. Availability and security must be defined for the respective purpose and closely monitored – by OT and IT alike.
Integrating monitoring results from PRTG into NetBrain maps makes the foundation for network automation.

With ScriptRunner Paessler integrates a powerful event automation platform into PRTG Network Monitor.
Custom alerts and data visualization let you quickly identify and prevent network downtime.
Network Monitoring Software – Version 24.4.102.1351 (November 12th, 2024)
Download for Windows and cloud-based version PRTG Hosted Monitor available
English, German, Spanish, French, Portuguese, Dutch, Russian, Japanese, and Simplified Chinese
Network devices, bandwidth, servers, applications, virtual environments, remote systems, IoT, and more
Choose the PRTG Network Monitor subscription that's best for you


A network ping tool is a software used to test the reachability and response time of a network device, such as a server, computer, or router, from another device. It helps determine whether a remote device is online, how long it takes for a message to travel to the destination and back (round-trip time), and whether there is packet loss or network congestion.
The term "ping" comes from sonar technology, where a pulse of sound is sent out, and the time it takes for the echo to return is measured.
PRTG’s network ping tool measures response time by sending ICMP echo requests (ping) to an IP address and waiting for an echo reply. PRTG comes with several preconfigured sensors for measuring network pings out of the box:
For most applications, a latency below 100 milliseconds or less is acceptable. But for real-time applications like VoIP or online gaming, latency should ideally be below 30 milliseconds to ensure optimal performance. It’s the difference between a quick reply and a slow one – lower latency means better performance.
Yes, PRTG stores historical data, allowing you to analyze ping results over time and identify recurring network issues. This historical data is important for long-term network performance analysis and troubleshooting. A complete log of your network’s health, PRTG helps you spot patterns and prevent future problems.
Yes! PRTG includes specific sensors designed to measure, monitor, and analyze packet loss. These capabilities help identify and resolve issues that cause data loss, ensuring a more reliable network performance. It’s the leak detector for your network, catching data leaks before they cause major damage.
In PRTG, “sensors” are the basic monitoring elements. One sensor usually monitors one measured value in your network, for example the traffic of a switch port, the CPU load of a server, or the free space on a disk drive. On average, you need about 5-10 sensors per device or one sensor per switch port.
Paessler conducted trials in over 600 IT departments worldwide to tune its network monitoring software closer to the needs of sysadmins. The result of the survey: over 95% of the participants would recommend PRTG – or already have.

Paessler PRTG is used by companies of all sizes. Sysadmins love PRTG because it makes their job a whole lot easier.
Bandwidth, servers, virtual environments, websites, VoIP services – PRTG keeps an eye on your entire network.
Everyone has different monitoring needs. That’s why we let you try PRTG for free.