


Custom alerts and data visualization let you quickly identify and prevent all kinds of issues in your entire network.
Network diagram tools play a crucial role in all professional network environments, helping network engineers to keep track of everything that is important. Here’s how PRTG can help you with creating your custom network diagrams.
PRTG makes it easy to build your own network maps and diagrams. With our drag-and-drop Map Editor feature, you can visualize dependencies, add background images such as data center floor plans, and choose from many other prebuilt widgets for your individual visualization.
Include all the network components you want to keep an eye on in your network diagrams – from routers and switches to servers and firewalls. With color-coded visual representation, you see at a glance if there’s an issue in your infrastructure and act before the problem becomes business critical.
Need to view more than one network topology diagram? No problem. PRTG lets you set up your HTML-based maps to rotate on screen so you don’t have to choose between individual views of your network infrastructure and always know what’s going on in your entire network.
Diagnose network issues by continuously tracking the availability, health, and performance of your entire network via custom logical network designs. Show hardware parameters, network traffic, bandwidth usage, and other key metrics in real time. Visualize monitoring data in clear graphs and dashboards to identify problems more easily. Gain the overview you need to troubleshoot all kinds of issues in you LAN, WAN, virtual, or cloud infrastructure.

Live traffic data graph in PRTG
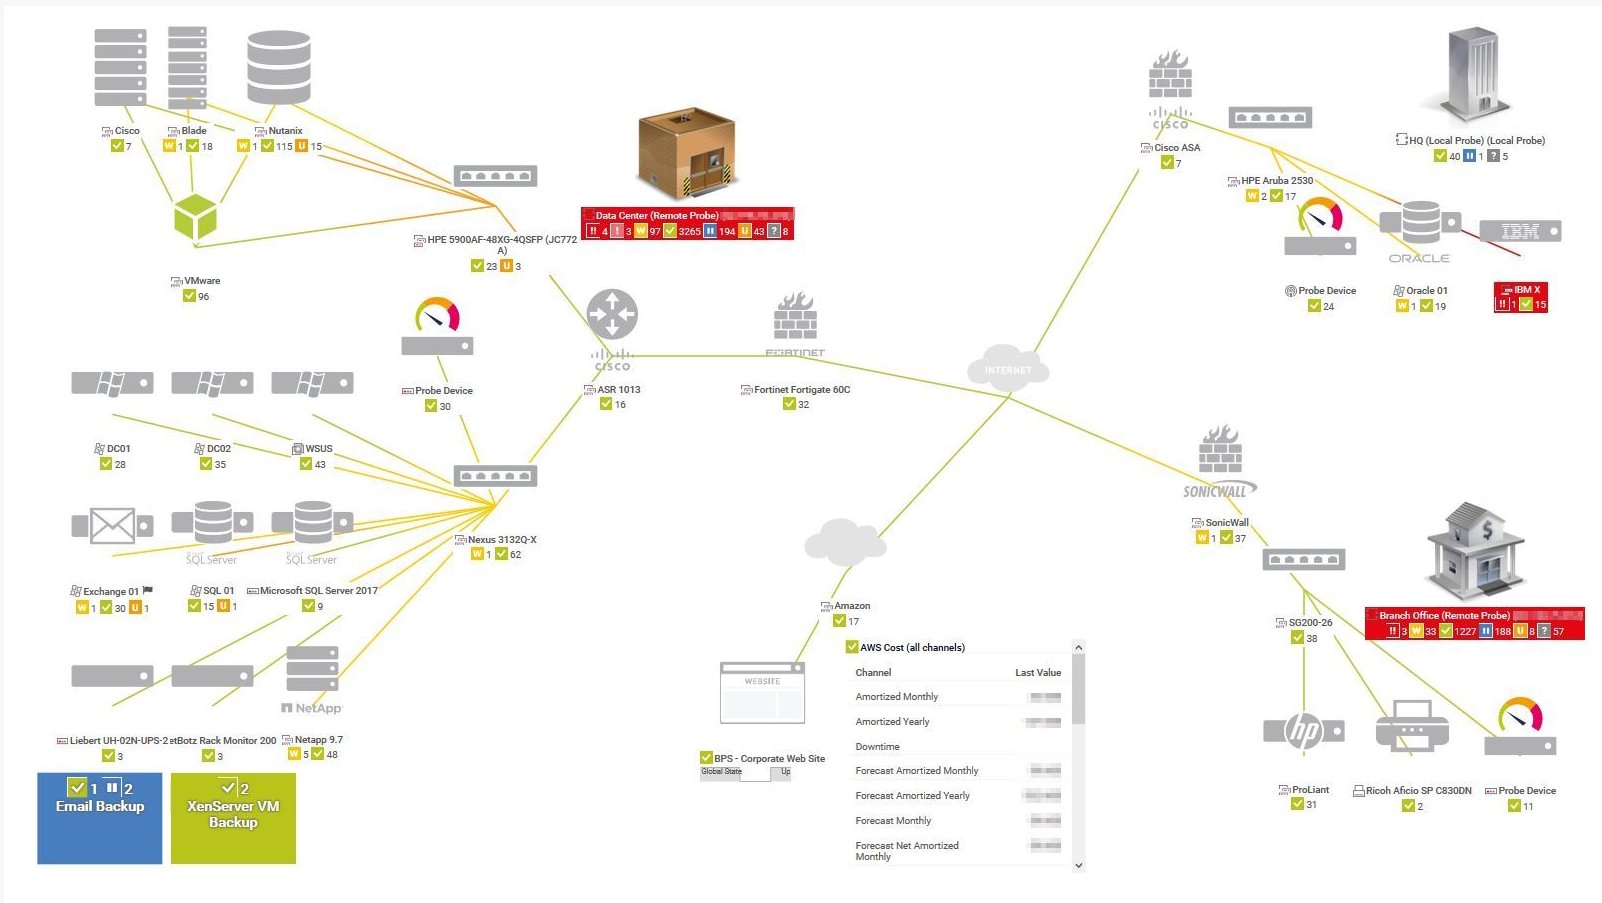
Network topology map in PRTG
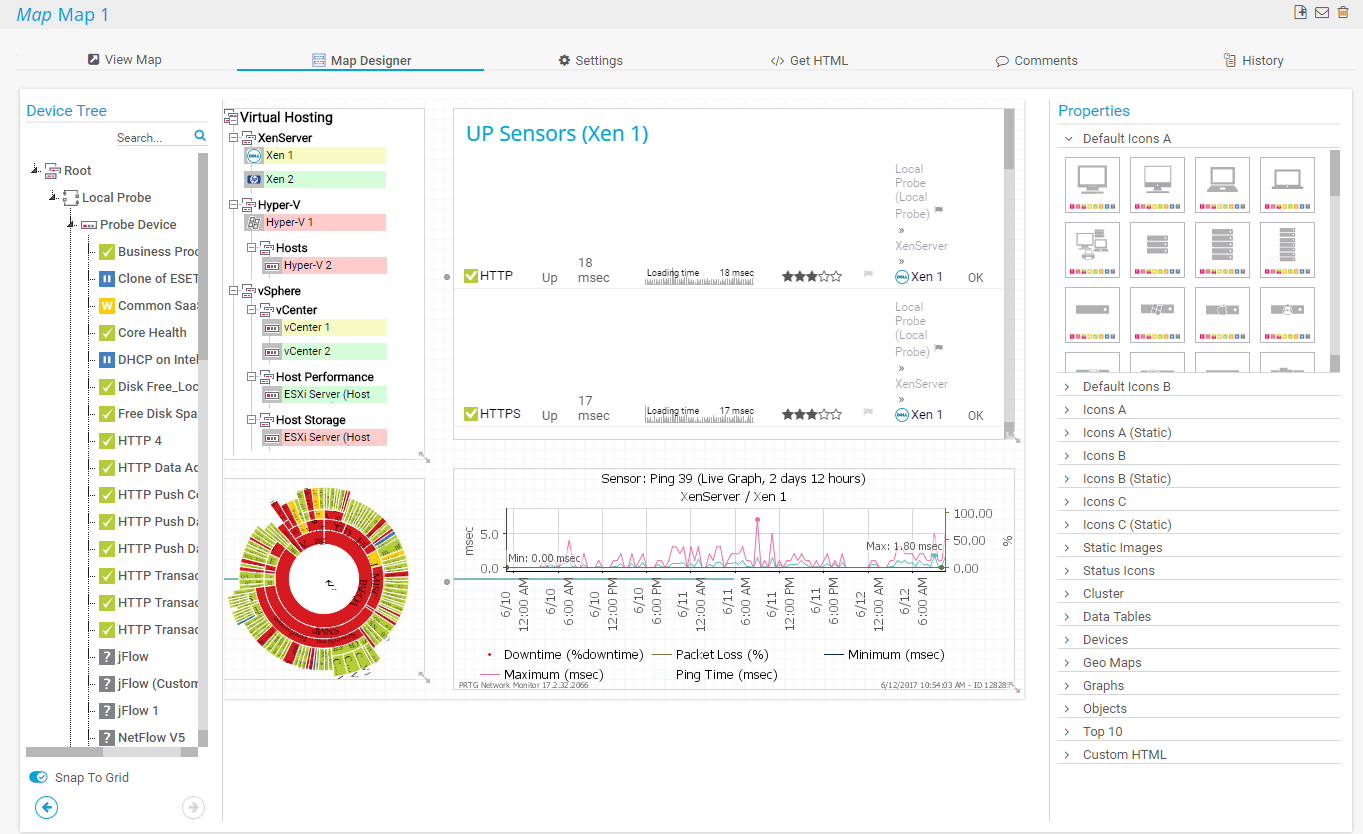
Map designer in PRTG

Device tree view of the complete monitoring setup

Custom PRTG dashboard for keeping an eye on the entire IT infrastructure
Live traffic data graph in PRTG
Network topology map in PRTG
“All-around winning
network monitor”
“The real beauty of PRTG is the endless possibilities it offers”
“PRTG Network Monitor
is very hard to beat”
With PRTG, you can build your own custom network diagrams with an individual focus on your business or infrastructure.
PRTG scans your subnets regularly and displays the discovered network devices in a clear device tree view. You can also choose from two further visualizations – the Sunburst view or a heatmap view. All components are clickable so that you can drill down into your infrastructure as needed.
Using the PRTG drag-and-drop editor, you can also easily create concise custom network diagrams, maps, and dashboards. This way, you get helpful, visual representations that are clear, based on your individual requirements, and minimize alert information overload.
Use HTML to enrich the custom diagrams with additional information such as weather and traffic services, or to manually create layers on your maps. For an automated “layer-to-map” functionality, try the UVexplorer integration via the PRTG API.
The ability to customize is the strength of PRTG diagrams. While other diagrams of complex networks can quickly become overwhelming, the custom maps of PRTG can be reduced to the essentials. Select the topology and elements you really need to see, and leave out everything else.
Custom alerts and data visualization let you quickly identify and prevent all kinds of issues in your entire network.

Generally, there are two different kinds of tools for creating network diagrams: automated network scanners or manual network diagram tools.
Manual applications usually provide you with symbols for switches, servers, printers and the like, enabling you to draw a custom diagram of your network.
Automated network scanners independently scan your network via ping, SNMP, WMI, and other protocols to find existing components and add them to an automated network view.
Both types of network diagram programs have their advantages and disadvantages. Manual diagram tools, which focus on customization, have a large feature set and fit exactly to an organization’s needs. However, they require IT staff who either know the whole structure of the network in depth or have access to all the information needed to create the diagram.
The advantage of a network scanner, which works more independently, is that the diagram can be created without any human interaction. If you configure the scan job as a recurring task, the network maps are even automatically kept up-to-date. However, they might not include the information admins really need and might require manual tweaking afterward.
PRTG’s advanced network diagram tools offer automated network discovery and diagram creation as well as a drag-and-drop map editor for custom network mapping, thus combining the advantages of both automated network scanners and manual diagram tools.
It scans the network to automatically identify devices and their connections, reducing the manual effort of creating a network map. As network conditions change, it can update the network view in real time, ensuring it is always current.
On the other hand, PRTG lets you easily create your own dashboards, maps, and diagrams - just the way you like them – using the drag-and-drop PRTG map editor.
Real-time notifications mean faster troubleshooting so that you can act before more serious issues occur.
Set up PRTG in minutes and use it on almost any mobile device.

Partnering with innovative IT vendors, Paessler unleashes synergies to create
new and additional benefits for joined customers.
Integrating monitoring results from PRTG into NetBrain maps makes the foundation for network automation.

Combining PRTG’s broad monitoring feature set with IP Fabric’s automated network assurance creates a new level of network visibility and reliability.

Combining their tools to a powerful solution for advanced analysis and automation, KnowledgeRiver and Paessler enable IT teams to ensure best performance for their infrastructure and networks.
Custom alerts and data visualization let you quickly identify and prevent all kinds of issues in your entire network.
Network Monitoring Software – Version 25.1.104.1946 (March 18th, 2025)
Download for Windows and cloud-based version PRTG Hosted Monitor available
English, German, Spanish, French, Portuguese, Dutch, Russian, Japanese, and Simplified Chinese
Network devices, bandwidth, servers, applications, virtual environments, remote systems, IoT, and more
Choose the PRTG Network Monitor subscription that's best for you


A network diagram maker is a tool or software application used to create visual representations of a computer network's structure, connections, and components. These diagrams help in understanding, planning, designing, and troubleshooting networks by illustrating how devices such as routers, switches, servers, and computers are interconnected.
Key features of a network diagram maker include:
Network diagram tools offer a range of benefits that help organizations and IT professionals efficiently manage, plan, and troubleshoot their networks. Here are the key benefits:
Network diagrams come in various types, depending on what aspect of the network they focus on, and the level of detail required. Here are some network diagram examples:
Yes! PRTG offers comprehensive monitoring for a wide range of web server applications, including Apache, Nginx, IIS, and more. Whether you’re running on Windows, Linux, or a mixed environment, PRTG provides the flexibility to monitor all key metrics relevant to your web server’s performance.
In PRTG, “sensors” are the basic monitoring elements. One sensor usually monitors one measured value in your network, for example the traffic of a switch port, the CPU load of a server, or the free space on a disk drive. On average, you need about 5-10 sensors per device or one sensor per switch port.
Paessler conducted trials in over 600 IT departments worldwide to tune its network monitoring software closer to the needs of sysadmins. The result of the survey: over 95% of the participants would recommend PRTG – or already have.

Paessler PRTG is used by companies of all sizes. Sysadmins love PRTG because it makes their job a whole lot easier.
Bandwidth, servers, virtual environments, websites, VoIP services – PRTG keeps an eye on your entire network.
Everyone has different monitoring needs. That’s why we let you try PRTG for free.

