Custom alerts and data visualization let you quickly identify and prevent availability, health, and performance issues of your Cisco Meraki equipment.
Powerful. Reliable. Scalable. Secure. When it comes to cloud-managed enterprise IT solutions, Cisco Meraki is hard to beat. But that doesn’t mean you can set it and forget it.
Disruptions, bottlenecks, and other issues can still arise. Plus, you’ll want to plan ahead and make sure you’re not overloading your equipment (or paying for more than you actually need). Paessler PRTG’s real-time, round-the-clock cloud monitoring tool makes the process simple and straightforward.
As an official Cisco Meraki technology partner, we have the inside track into how these products work, and can design monitoring tools that integrate seamlessly into your workflow with minimal impact on performance.
Even better, PRTG doesn’t just monitor Cisco Meraki network components, but your entire IT infrastructure. Which means you’ll have a single, unified view of your network’s topology, health, and performance, and can optimize resources and carry out capacity planning with confidence.
Diagnose network issues by continuously tracking Wi-Fi access points, switches, firewalls, SD-WAN, security appliances, cameras, IoT devices, and other Cisco Meraki solutions . Show availability, bandwidth usage, network traffic, uptime, and other key metrics in real time. Visualize monitoring data in clear graphs and dashboards to identify problems more easily. Gain the overview you need to troubleshoot slow response times and other performance issues.

Live traffic data graph in PRTG

Device tree view of the complete monitoring setup

Custom PRTG dashboard for keeping an eye on the entire IT infrastructure
Live traffic data graph in PRTG
Device tree view of the complete monitoring setup
“All-around winning
network monitor”
“The real beauty of PRTG is the endless possibilities it offers”
“PRTG Network Monitor
is very hard to beat”
Key in an IP address range, and the automatic network discovery will take care of everything – finding Cisco Meraki and other network hardware and software, and assigning the right sensors. You don’t even need to install specialized software agents (though you can use PRTG as an agent-based monitor if you want to).
Why waste time switching between environments when you can keep an eye on your entire IT infrastructure with one monitoring tool? PRTG's preconfigured sensors can track every parameter imaginable. And if you can’t find a preconfigured sensor to suit, you can create your own.
Make unplanned downtime a thing of the past. PRTG keeps a close eye on all your critical Cisco Meraki security, health, and performance stats (and the security, health, and performance stats of the rest of your network) round the clock and alerts you as soon as there are issues, so you can perform troubleshooting quickly, optimize performance, and maximize uptime.
Your IT infrastructure, your rules. PRTG is designed to work out of the box, with minimal tweaking. But you can tailor it to suit your exact requirements. Pick your preferred performance thresholds, configure your monitoring dashboards... you can even design your own reporting templates.
PRTG comes with more than 250 native sensor types for monitoring your entire on-premises, cloud, and hybrid cloud environment out of the box. Check out some examples below!
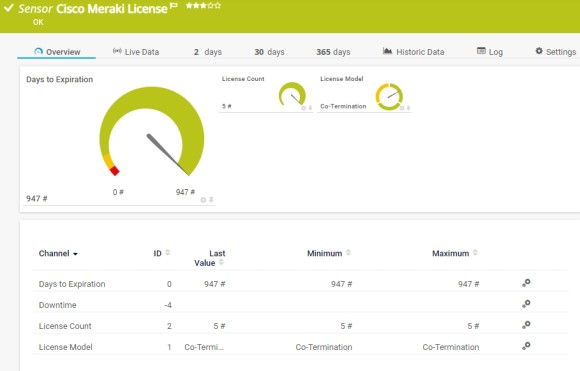
The Cisco Meraki License sensor monitors Meraki licenses of an organization via the Cisco Meraki Dashboard API. It can show the following:
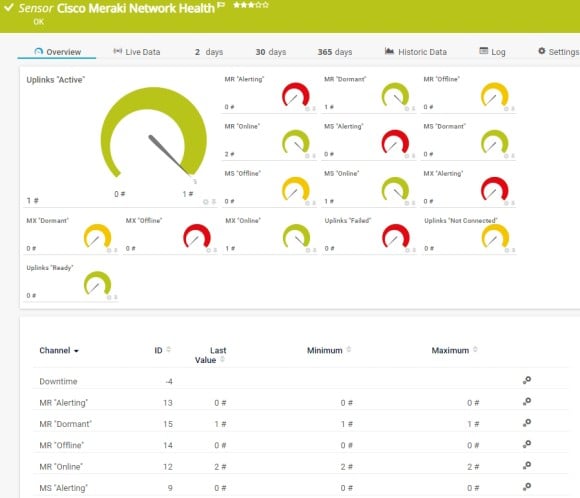
The Cisco Meraki Network Health sensor monitors the health of Cisco Meraki network devices via the Cisco Meraki Dashboard API. It can show the following:
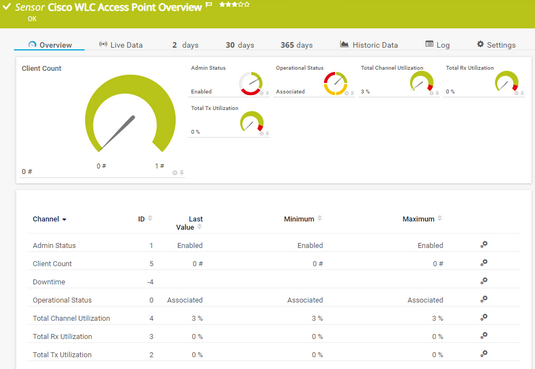
The Cisco WLC Access Point Overview sensor monitors the operational status of a wireless LAN controller (WLC) access point and provides a sum of various network utilization metrics of the available slots. It can show the following:
See the PRTG Manual for a list of all available sensor types.

Custom alerts and data visualization let you quickly identify and prevent availability, health, and performance issues of your Cisco Meraki equipment.
PRTG is set up in a matter of minutes and can be used on a wide variety of mobile devices.

By joining the Meraki Partners ecosystem, Paessler has become one of the technology providers that is entitled to lead the pack in integrating Cisco Meraki’s cloud networking platform with their solutions.
What does this mean for you?
Partnering with innovative IT vendors, Paessler unleashes synergies to create
new and additional benefits for joined customers.
Paessler is member of the mioty alliance, composed of companies that use mioty to create innovative IoT and IIoT solutions such as the retrofitting of industrial environments.
IT that works constitutes a business-critical basis for a company's success. Availability and security must be defined for the respective purpose and closely monitored – by OT and IT alike.
Combine the functionality of Sigfox and Paessler for the most comprehensive, cost-effective, and easy-to-use IoT solution available.
Real-time notifications mean faster troubleshooting so that you can act before more serious issues occur.
Network Monitoring Software – Version 24.4.102.1351 (November 12th, 2024)
Download for Windows and cloud-based version PRTG Hosted Monitor available
English, German, Spanish, French, Portuguese, Dutch, Russian, Japanese, and Simplified Chinese
Network devices, bandwidth, servers, applications, virtual environments, remote systems, IoT, and more
Choose the PRTG Network Monitor subscription that's best for you


Cisco Meraki is a cloud-managed IT solutions provider that offers a range of networking and security products designed to simplify the management of complex IT environments. Meraki's solutions are particularly known for their ease of deployment and use, providing centralized management through a web-based dashboard or mobile app.
PRTG is a proprietary software tool that tracks the health and performance of Cisco Meraki cloud, hardware, and software network components – and that of your entire IT infrastructure – from one monitoring environment. Available for Windows-based on-premises servers or as a cloud-hosted solution, it's capable of monitoring unlimited local, remote, and virtual network devices, bringing critical system data together in one simple, intuitive interface you can access from anywhere: at the office, at home, or on the go.
Three reasons. To spot and fix performance issues, prevent unplanned downtime, and carry out more effective capacity planning. PRTG keeps a close eye on all the variables that could impact your Cisco Meraki devices and software, giving you complete visibility and enabling you to be proactive.
PRTG's preconfigured sensors connect to Cisco Meraki's dashboard API. Enable API access on your Cisco Meraki dashboard and add your credentials into PRTG's device settings. You can then start adding Cisco Meraki sensors to your monitoring environment.
In PRTG, “sensors” are the basic monitoring elements. One sensor usually monitors one measured value in your network, for example the traffic of a switch port, the CPU load of a server, or the free space on a disk drive. On average, you need about 5-10 sensors per device or one sensor per switch port.
Paessler conducted trials in over 600 IT departments worldwide to tune its network monitoring software closer to the needs of sysadmins. The result of the survey: over 95% of the participants would recommend PRTG – or already have.

Paessler PRTG is used by companies of all sizes. Sysadmins love PRTG because it makes their job a whole lot easier.
Bandwidth, servers, virtual environments, websites, VoIP services – PRTG keeps an eye on your entire network.
Everyone has different monitoring needs. That’s why we let you try PRTG for free.