![]()
Server uptime monitoring with PRTG
24/7 server uptime is no myth – it’s a reality
- Monitor physical and virtual servers on a single dashboard
- Receive customizable alerts quicker than you can say “downtime”
- Optimize your server infrastructure to achieve 99.999% uptime
Our users give top ratings for monitoring with Paessler PRTG


PRTG server uptime monitoring: What you’ll find on this page

PRTG makes server uptime monitoring as easy as it gets
Custom alerts and data visualization let you quickly identify and prevent issues with server downtime and outages.
Avoid costly service interruption with tracking server uptime
We totally get it. Servers and services that are regularly unavailable are a major business risk. And when user satisfaction drops, revenue is lost, and maintenance costs skyrocket, it’s a tough spot to be in. But don’t panic, as Paessler PRTG is here to help you – designed to keep your servers running all day, every day.
Nail uptime issues with accuracy
Accurate and fast response times make all the difference when an issue arises. PRTG server uptime monitoring tools use monitoring protocols like ICMP, SNMP, SMTP, and WMI, alongside packet sniffing and NetFlow, to detect and diagnose issues quickly.
This helps you to troubleshoot server overloads, hardware failures, and system bottlenecks promptly – for high availability and continuous service.
Get customizable, instant alerts
You need to know as soon as possible when there’s an uptime issue. PRTG will send you immediate alerts via email, SMS, push notification, Slack message, and others when a threshold is breached.
Configure these alerts to your needs to focus on key uptime metrics that matter most to you. Your ability to proactively monitor your server uptime will make you look psychic. Employ your newfound powers to impress the CTO.
Streamline your server monitoring
Keep an eagle eye on your entire IT infrastructure with a single comprehensive network monitoring tool that reduces complexity and does away with compatibility issues.
Our server uptime monitoring solution gives you a top-down view of your entire network’s health. This makes it much easier to maintain high uptime by spotting and addressing issues proactively.
Ensure data security and integrity
Nobody wants strangers digging through their data. With PRTG, your monitoring data is secured through SSL/TLS encryption, using the strongest ciphers available to prevent unauthorized access.
This security is critical not only for protecting sensitive information but also for ensuring that uptime monitoring is not compromised by external threats.
What server uptime monitoring looks like in PRTG
Diagnose network issues by continuously tracking your server environment. Show server uptime, availability, and health metrics in real time. Visualize monitoring data in clear graphs and dashboards to identify problems more easily. Gain the overview you need to troubleshoot the root causes of issues with your entire server network infrastructure.

Device tree view of the complete monitoring setup
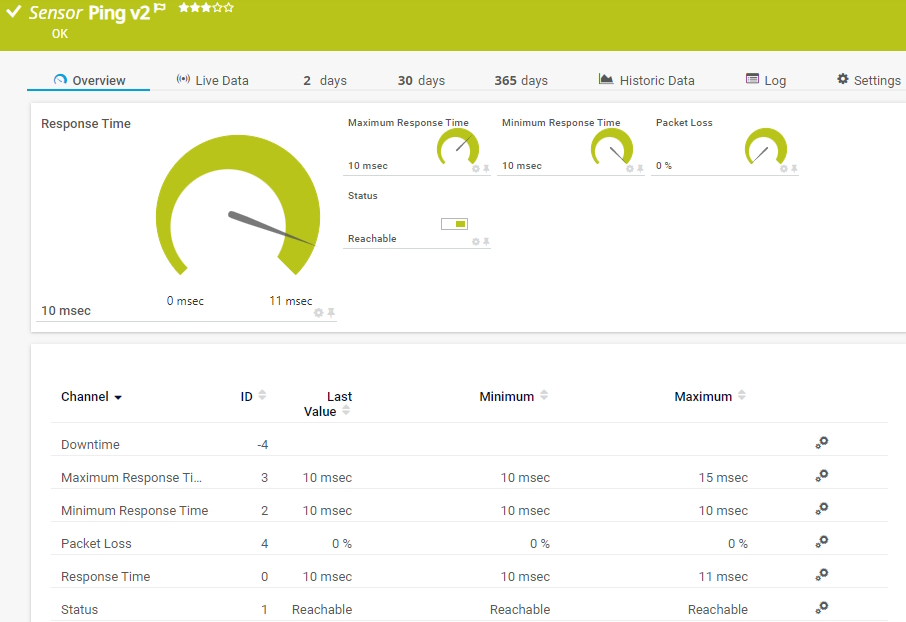
Preconfigured Ping v2 sensor in PRTG

Custom PRTG dashboard for keeping an eye on the entire IT infrastructure
Start monitoring server uptime with PRTG and see how it can make your network more reliable and your job easier.
IT experts agree: Paessler PRTG is a great solution for IT infrastructure monitoring

“All-around winning
network monitor”

“The real beauty of PRTG is the endless possibilities it offers”

“PRTG Network Monitor
is very hard to beat”
5 reasons why to choose PRTG as your server uptime monitoring tool
![]()
We have your servers covered
PRTG monitors the availability and health of your physical and virtual servers, DNS servers, mail servers, SQL servers, web servers, file servers,, SQL servers, web servers, file servers, Windows serverr, and more, using technologies such as SNMP, WMI, SSH, or Ping. Points of failure dwindle, and your peace of mind increases.
![]()
Get the data from now, right now
Dynamic dashboards and graphs, included with our uptime monitoring service, provide live feedback on the status of your servers, whether you're at your desk or halfway around the world. This real-time data is crucial for everyone involved to quickly make informed decisions and address issues.
![]()
Simply scalable server solution
PRTG grows with your business – easily integrate additional server endpoints and analyze increased network traffic without performance loss. Its flexible licensing, pricing, and architecture supports you all the way if you want to expand within data centers or across multiple monitoring locations.
Wide vendor compatibility
We designed PRTG to be compatible with most major hardware manufacturers out of the box. Easily integrate servers and other network devices from Dell, Cisco, HPE, IBM, Fujitsu, or Microsoft into your monitoring infrastructure via prebuilt sensor templates for a greater user experience.
Agentless monitoring software
PRTG makes server uptime monitoring as simple as possible. With it’s agentless monitoring architecture, you can monitor all server types without the need to install additional software on your network devices. The use of standard protocols and an easy-to-understand API reduces overhead.
Find the root cause of the problem with our PRTG server uptime monitoring solution
Real-time notifications mean faster troubleshooting so that you can act before more serious issues occur.
PRTG is compatible with all major vendors, products, and systems
![]()
Discover some preconfigured sensors for monitoring server uptime
PRTG comes with more than 250 sensor types for your whole network , including native sensors for a variety of different servers. A few clicks are all it takes to get an overview of your entire server landscape. Check out some examples for server uptime monitoring.
Ping v2
The Ping v2 sensor is the easiest way to check the uptime of servers. It can show the following:
- Minimum and maximum ping time when using more than one ping per interval
- Packet loss when using more than one ping per interval
- Ping time
- Target status
SNMP Uptime v2
The SNMP Uptime v2 sensor monitors the uptime of a device via the Simple Network Management Protocol (SNMP). It can show the following:
- Downtime
- System uptime
Windows System Uptime
The Windows System Uptime sensor monitors the uptime of a Windows system via Windows Management Instrumentation (WMI) or Windows performance counters. It can show the following:
- Downtime
- System uptime


Start monitoring server uptime with PRTG and see how it can make your network more reliable and your job easier.
PRTG is compatible with all major vendors, products, and systems
![]()
Create innovative solutions with Paessler’s partners
Partnering with innovative vendors, Paessler unleashes synergies to create
new and additional benefits for joined customers.


ScriptRunner
With ScriptRunner, Paessler integrates a powerful event automation platform into PRTG Network Monitor.
“Excellent tool for detailed monitoring. Alarms and notifications work greatly. Equipment addition is straight forward and server initial setup is very easy. ...feel safe to purchase it if you intend to monitor a large networking landscape.”
Infrastructure and Operations Engineer in the Communications Industry, firm size 10B - 30B USD
PRTG makes server uptime monitoring as easy as it gets
Custom alerts and data visualization let you quickly identify and prevent issues with server downtime and outages.

PRTG: The multi-tool for sysadmins
Adapt PRTG individually and dynamically to your needs and rely on a strong API:- HTTP API: Access monitoring data and manipulate monitoring objects via HTTP requests
- Custom sensors: Create your own PRTG sensors for customized monitoring
- Custom notifications: Create your own notifications and send action triggers to external systems
- REST Custom sensor: Monitor almost everything that provides data in XML or JSON format
We asked: would you recommend PRTG?
Over 95% of our customers say yes!
Paessler conducted trials in over 600 IT departments worldwide to tune its network monitoring software closer to the needs of sysadmins.
The result of the survey: over 95% of the participants would recommend PRTG – or already have.

Still not convinced?
![]()
More than 500,000
sysadmins love PRTG
Paessler PRTG is used by companies of all sizes. Sysadmins love PRTG because it makes their job a whole lot easier.
![]()
Monitor your entire IT infrastructure
Bandwidth, servers, virtual environments, websites, VoIP services – PRTG keeps an eye on your entire network.
![]()
Try Paessler PRTG
for free
Everyone has different monitoring needs. That’s why we let you try PRTG for free.
![]()
Start monitoring server uptime with PRTG and see how it can make your network more reliable and your job easier.
|
PRTG |
Network Monitoring Software - Version 25.1.104.1961 (April 7th, 2025) |
|
Hosting |
Download for Windows and cloud-based version PRTG Hosted Monitor available |
Languages |
English, German, Spanish, French, Portuguese, Dutch, Russian, Japanese, and Simplified Chinese |
Pricing |
Up to 100 sensors for free (Price List) |
Unified Monitoring |
Network devices, bandwidth, servers, applications, virtual environments, remote systems, IoT, and more |
Supported Vendors & Applications |
|
Discover more monitoring insights and stories

Solutions for all your monitoring needs

Powerful stories from the monitoring world
